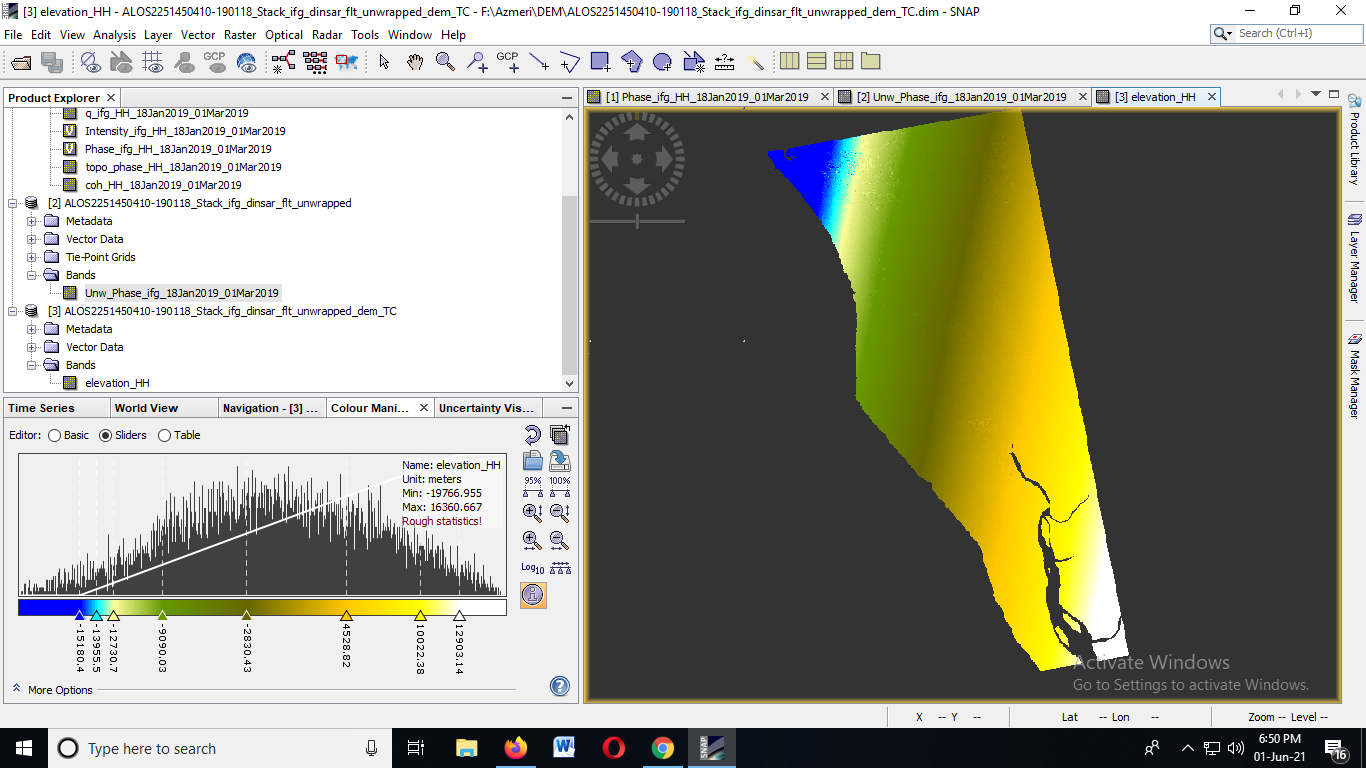
Yes. I followed all the steps and even ended up with a DEM but then majority of the elevation values are coming negative. How can I convert them to absolute values? and also the linear units are showing in degrees instead of meters, what should I do?
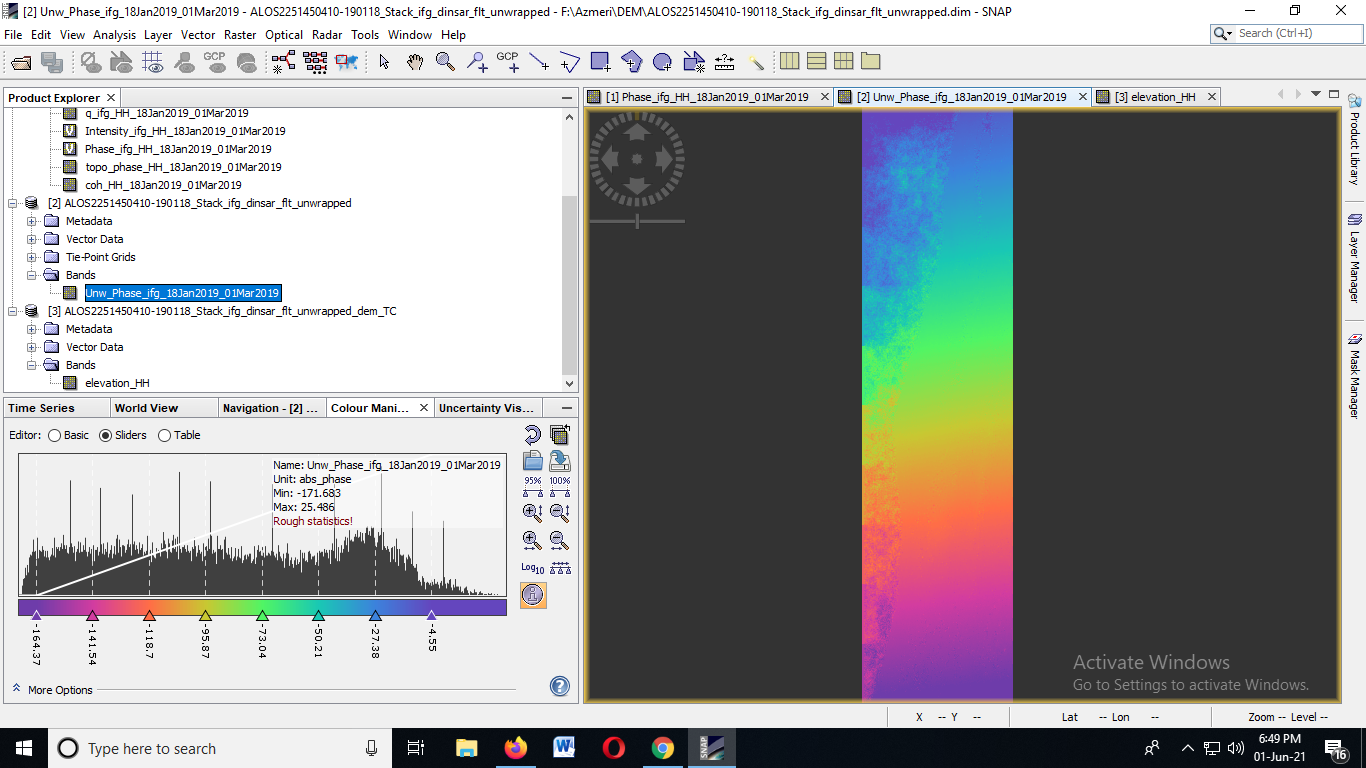
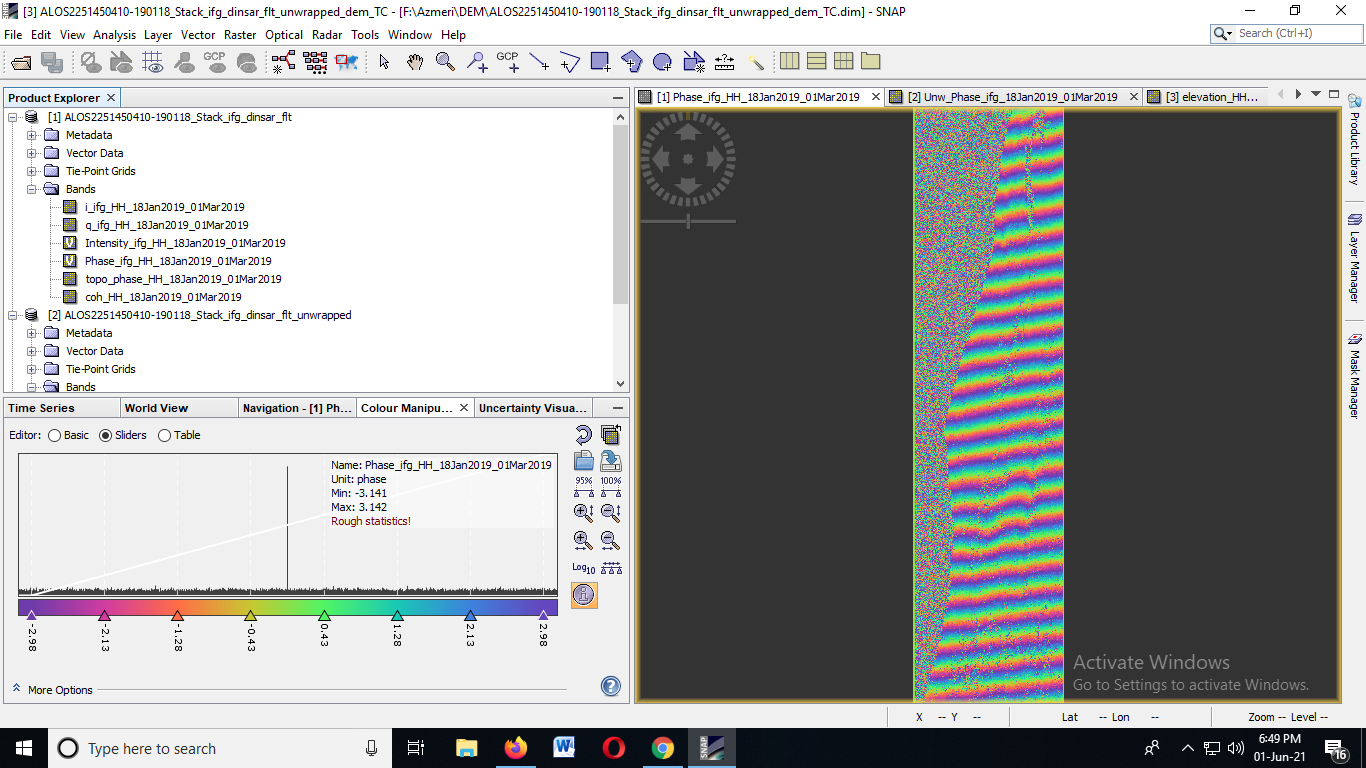
there is a strong ramp inside the interferogram, probably because of ionospheric impacts (L-band is more sensitive). We discussed this in here: Interferogram from Alos palsar 1.1 data
It is obvious that these are no topographic fringes, so it makes little sense to proceed with the analysis before the interferogram does not look better. This probably also explains the negative values.
Thank you. Also, How to compute the plane that fits the ionospheric related phase contribution and how to remove it without going for PSI/SBAS only utilizing single pair?
future versions of SNAP will probably have operators to remove ionospheric phase, but currently this is not possible. But it is implemented in GITASAR: SAR image processing for beginners
PSI/SBAS approaches cannot be perfomed on single image pairs, they are based on time-series principles and require at least 20 images if you want good results. Also, they were developed to calculate surface deformation, not DEMs.
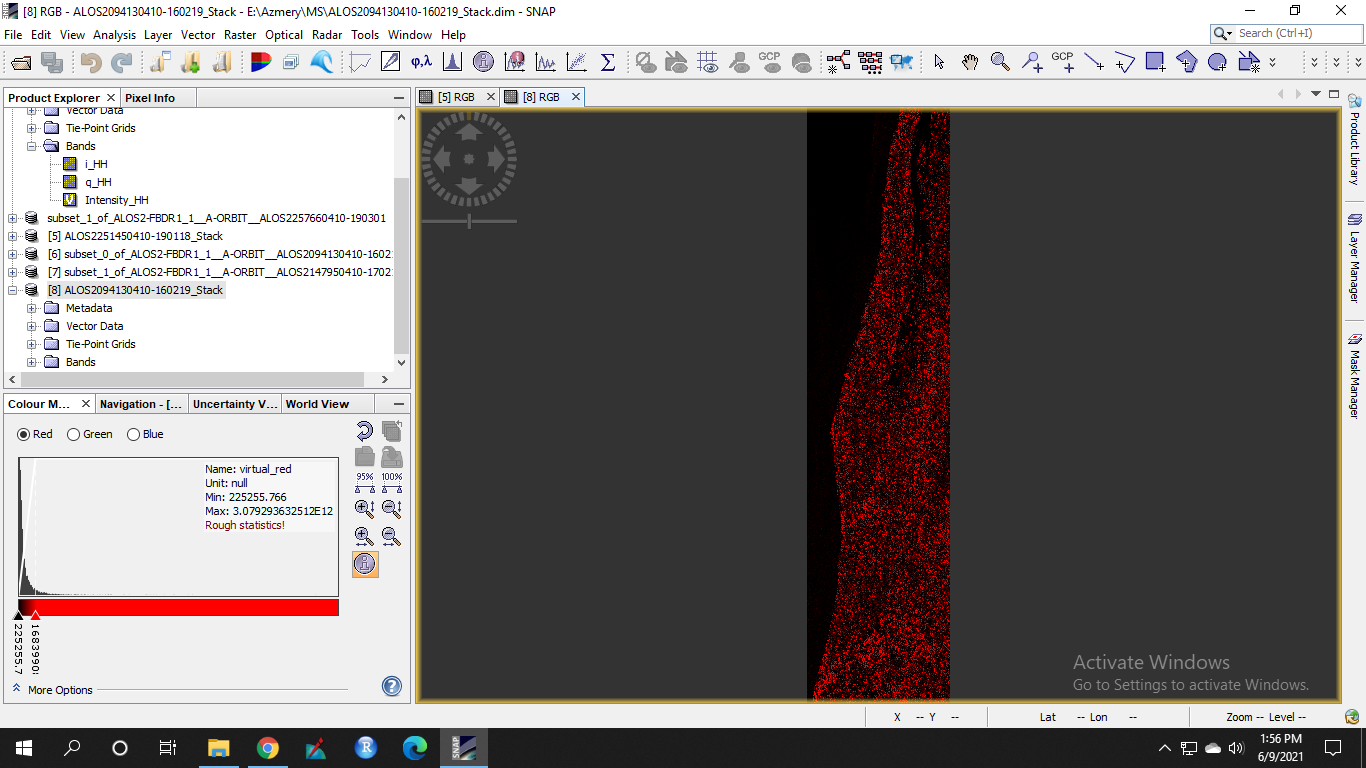
Hello thank you for answering, I started the whole process with another set of images. However, after co-registration the rgb image is fully red. How can I solve this issue? Ps I am still working with ALOS PALSAR 2
Yes, both the images cover the same track and area ( same orbit and path) but the latitude and longitude is slightly different( difference in decimals). Could this be a problem?