Hi team,
I want to know about the Cloud Probability band (CLD_20m.jp2 or CLD_60m.jp2) in L2A QI Product. I already read some details from [Sentinel-2 L2A] documentation.
- Is it a Cloud Probability band or not?
- If yes then what is the Range of values?
Because I found a range of 0-137 in "s3://sentinel-s2-l2a/tiles/44/P/MC/2025/2/13/0/qi/CLD_20m.jp2" file. Does this file have Bad values? (if you can give me some context)
Dear @mirjan.sha,
The Cloud_Probability mask (coded in byte) indeed reports a probability (in the range [0; 100]) that a pixel is a cloud.
The spurious values you can see (a range of 0-137) are likely caused by jp2 handling/compression and may not reflect the actual values of the mask. Sometimes software like QGIS or GDAL rely on internal pyramidal layers to build their statistics that are not fully “in line” with the exact statistics at full resolution. In that case at 20m resolution, with an image of 5490 x 5490 pixels.
You may want to try to get the percentage distribution by using a python script, e.g.:
#!/usr/bin/env python
from osgeo import gdal, ogr
input_file = ‘./MSK_CLDPRB_20m.jp2’
data = gdal.Open(input_file)
cloud_array = data.GetRasterBand(1).ReadAsArray()
# min and max values
min_val = cloud_array. min*()*
max_val = cloud_array. max*()*
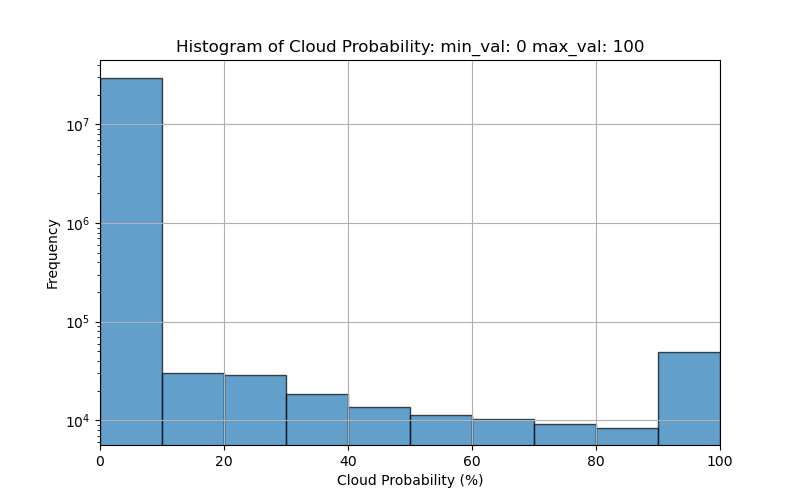
In your case, with the Cloud_Mask at 20m associated with the product S2B_MSIL2A_20250213T045829_N0511_R119_T44PMC_20250213T070437.SAFE, we see a min of 0 and a max of 100. See also the histogram attached.
Cheers,
@Sen2cor_dev_team
Thank you so much @Sen2cor_dev_team for the clarification.