The radar measures LOS-displacement. If one has only one observation-geometry that is not enough measurements to solve for NS/EW/up-down components without extra assumptions (for example vertical movement only). If one can assume vertical movement only, then the conversion from LOS to vertical can be done simply using the incidence-angle.
1 Like
You said “(let’s assume that the target point n has moved up by an amount of h)”, so “h” is the “vertical displacement”, right? By vector algebra “h” is the vertical component of vector of LOSD, what does “(_h_cos*theta)” in the equation “phase_n’ = (-4pi / wavelength)(_h_cos*theta)” mean? it should be “h/cos(theta)”. So when converting the phase difference to the vertical displacement with the help of incident angle as defined above, the cos term should be in the numerator, not in denominator as someone told to zealandia_sarah above.
According to Z.Lu and D.Dzurisin, 2014, h*cos(theta) is used to convert LOS into vertical displacement. This equation is slightly different than the one posted here.
Why cos(theta) should be in the nominator?
Also, the big displacement value (30 cm) you see on your results is due to atmospheric errors. Additional fringes are created in your interferogram due to atmospheric delay and these fringes are interpreted as displacement. So, atmospheric corrections should be applied.
If “d” is LOSD and “h” is corresponding vertical displacement, then “h=dcos(theta)" which means “h” is “d”'s projection on a vertical line. So from the correct equation "(phaseDifference)=(4PId)/(waveLength)" ( from ESA’s report TM90, equation 2.6 ) the correct equation should be "h=(phaseDifference)(waveLength)cos(theta)/(-4PI)”, here cos term is in numerator, “-” sign means a positive “h” is an uplift. I can not find Lu’s paper online, but I think “hcostheta" or "hcos(theta)” has not a geometric meaning.
Thank you very much for pointing out that an atmospheric correction should be applied! Can SNAP do this? Can SNAP find the relative atmospheric data automatically ( just as it can find the relative orbit information and DEM automatically in processing )? If not, where can I find it and import it to SNAP when processing? Is there a tutorial material for doing atmospheric correction?
Atmospheric corrections is the tricky part of InSAR processing but very important. If SAR images were acquired under severe weather conditions, the tropospheric error (in the worst case scenario) can be up to 9cm in your measurements. This 9cm corresponds to a few fringes on your interferogram which must be removed.
SNAP does not perform atmospheric corrections for InSAR. For applying atpospheric corrections we need to have precise measurements of the composition of the troposphere (this is where the most signal delay occurs). The good news is that there is a python library (PyAPS) that perform atmospheric corrections.
http://earthdef.caltech.edu/projects/pyaps/wiki/Main
You can have a look at the website.
1 Like
Hi liniC,
I think what @johngan said is correct, it should be h=d/cos(theta) when convert LOS displacement d to vertical displacement h, it means d is h’s projection on LOS direction. And I have confirmed it by levelling data used in my experiment.
Hope this helps,
Fei
5 Likes
Atmospheric corrections help but they are not perfect. If your test area has persistent scatterers you could do PSI-processing with StaMPS (PSI is able to estimate the atmopheric state from the data itself). This requires a stack of data, however, so the processing is much more involved.
2 Likes
Hi, Fei,
After processing what you get first is d( LOSD ), then you decompose it to h( vertical displacement ) and l( horizontal displacement ). The angle between d and surface normal( vertical direction, or h’s directiion ) is so called incident angle( theta ) as johngan shows above. So in vector algebra d=h+l, hence h=d*cos(theta) in magnitute. If you think h=d/cos(theta), which you say “it means d is h’s projection on LOS direction( d’s direction )”, where is the corresponding “horizontal displacement”? It is no longer perpendicular to the surface normal. Please note |cos(theta)|<=1, so if decomposed as I mentioned above, the magnitude of either h or l is less or equal to the magnitude of d. ( I am sorry that the picture is not very good, just for showing the meaning of d, h, l and (theta) in geometry. )

Hi, liniC
What we called displacement is actually a 3-D vector, decompose it to vertical displacement h, horizontal dispalcement l and azimuth displacement a is one way, decompose it to acsending LOS displacement d1, descending LOS displacement d2 and azimuth displacement a is another way.
So, as mengdahl has already mentioned, it is not possible to solve 3-D displacement if we only have one observation. Therefore, we assume only have vertical displacement h, which means horizontal displacement l and azimuth displacement a don’t exist. The picture can be seen as follows:
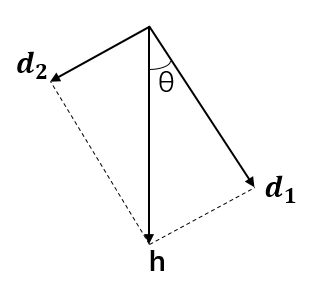
I’m not sure whether d1 and d2 are orthogonal, but they don’t have to be.
Hope this helps
Fei
2 Likes
In vector algebra a vector can be decomposed in many ways, but in engineering we have to be sure each component has an affirmatory physical meaning. If d( LOSD ) is decomposed to h and l as I mentioned above, h is the vertical displacement which magnitude can be known as h=dcos(theta), ( theta is the incident angle ), l is the horizontal displacement which magnitude can be known as l=dsin(theta) and which can be decomposed further in lon-lat coordinate system or in other 2D system with the help of additional range and azimuth information.
In the InSAR processing what you get first is d, not h, what do you mean to project h to d’s direction? In your graph, d1 is the projection of h to LOSD’s direction, actually it is d. How do you do this projection before knowing h? What is the physical meaning of d2? As shown in your graph it is a displacement with a vertical component and out of the horizontal surface( ground surface ). It sounds strange. If “d is h’s projection on LOS direction” as you said before, it must be a rectangle in your graph. Yet you even are “not sure whether d1 and d2 are orthogonal”?
Dear liniC,
We assumed that only vertical displacement exist, horizontal displacement and azimuth direction displacement equal zero, only in this way, we can use one observation, which is LOS displacement d, to solve displacement by equation h=d/cos(theta). In this case, h is true value, d is observation, the physical meaning is we observe the h’s projection in LOS direction d.
d1 and d2 in my graph represent acsending and desending LOS displacement respectively, they can be a basis even they are not orthogonal. Gethering acsending and desending displacements allows us to estimate 3-D displacement instead of simply assuming only exist vertical displacement.
All the best,
Fei
3 Likes
Thank you very much for the information!
I have heard and searched online that “PSI( Persistent Scatterer Interferometry )” looks a relatively new and better method to measure the ground displacement over a time period by the satellite images. Has SNAP introduced some or all of its functions into processing steps?
PSI is they way to go for measuring ground displacement but it requires many images acquired over the same area of interest (20-25). StaMPS (https://homepages.see.leeds.ac.uk/~earahoo/stamps/) is the most popular method for performing PSI analysis. It requires to have matlab installed in your PC though. Using SNAP, you can export your unwrapped phases into StaMPS format and perform PSI.
Based on your previous messages you are lack of basic knowledge about geodesy and vector algebra. If “only vertical displacement exist”, how can you guarantee in a geologic event that the ground just moves up or down, no slide? How can this kind of ridiculous assumption be adopted in engineering?
Please discuss with respect. You are free to disagree with anything stated here but don’t attack users at a personal level. Calling contributions of others who are genuinely trying to help you ‘ridiculous’ is not helping in any way. If you think different about discussed points, please bring up your arguments.
In this forum, users from different domains come together, including science, engineering, software development, physics/mathematics and industry/business. We expect everyone to consider the underlying linguistic variety when talking about issues and solutions.
6 Likes
Hi, ABraun,
Sorry about that! If you can please remove what I have posted. Thank you very much for the advice!
Ning.
1 Like
Hi, Johngan,
As I searched online the main steps and advantages of PSI are (a) it uses features of Permanent Scatterers found in images to improve the accuracy of co-registration for several images before interferometry; (b) the phase( or its difference ) computed by interferometry will have less errors; © it exploits a “2+1D phase unwrapping” using a set of redundant
interferogram result to compute the displacement.
In the Help of SNAP for PSI/SABS there is only 1 item described – “StaMPS Export”. In its description it looks SNAP have done both (a) and (b) above, and in your previous message that “you can export your unwrapped phases into StaMPS format and perform PSI.” If so, (1) In the result of SNAP exported to StaMPS, what is the criteria SNAP considers a feature in the image as a PS( Permanent Scatterer )? or where can I find a relative paper? (2) It looks SNAP’s “StaMPS Export” function exports wrapped phase, not un-wrapped phase, to StaMPS, because usually SNAP does not do un-wrapping, right?
Thank you for the help!
liniC.
In order to perform PSI, the same procedure as InSAR is followed in terms of processing the data (TOPS co-registration, interferogram formation, deburst). Deformation can only be measured over available PS. High density of PS can be identified on building and roads (objects that do not change rapidly in time) while very low density of PS can be identified in vegetated areas.
For selection of PS , phase stability and amplitude dispersion are used.
StaMPS is by far the most popular method for performing PSI (I have never used it myself as i do not have licence for matlab).
What you need to do is to create interferograms for your area of interest, deburst and stuck them (elevation band is also required i think). Then you can export this file into StaMPS. If you need more information on this, you can visit the discussion in this forum about staMPS and PSI . How to prepare Sentinel-1 images stack for PSI/SBAS in SNAP 5
Below, you will find a PDF where it explains what command to run for performing PSI in StaMPS.
D4P2a_LTC2015_Hooper.pdf (1.1 MB)
1 Like
I think you can look this up on sentinel 1’s official esa page under technical specs. (the site where they list all the hardware specs etc.) They also have the angle and swath length and stuff 
I have observed it correspond to my own metadata in snap.