Hello Everyone,
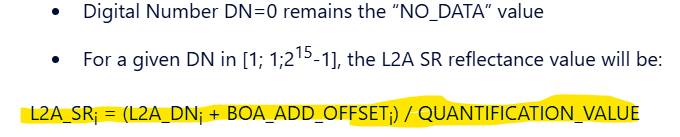
I am getting difference in ndvi results computed via rasterio and SNAP.I am doing this on RAW imagery that I downloaded from https://dataspace.copernicus.eu/ .I am using SNAP 9.0 and I have used NDVI Processor to calculate NDVI on SNAP Tool.I have also noticed that SNAP reads bands values between 0 and 1 while rasterio uses UINT16 data type. I am attaching the screenshots below
Polygon = POLYGON((73.24819412786306 32.521843540039484,
73.25105892991965 32.521843540039484,
73.25105892991965 32.52284573593144,
73.24819412786306 32.52284573593144,
73.24819412786306 32.521843540039484))
Tile Name: S2A_MSIL2A_20230224T054821_N0509_R048_T43SCS_20230224T090324.SAFE
Rasterio code:
import rasterio
import numpy as np
from shapely.geometry import Polygon
import pyproj
from shapely.geometry import box
from rasterio.mask import mask
def calculate_ndvi(red_band, nir_band):
ndvi = (nir_band.astype(np.float64) - red_band.astype(np.float64)) / (nir_band.astype(np.float64) + red_band.astype(np.float64))
ndvi = np.ma.masked_invalid(ndvi)
return ndvi
def get_polygon(coordinates, file_path):
with rasterio.open(file_path) as src:
original_polygon = Polygon([(coord[“g”], coord[“f”]) for coord in coordinates])
    # Create a transformer to convert polygon CRS to raster CRS
    transformer = pyproj.Transformer.from_crs(pyproj.CRS('EPSG:4326'), src.crs, always_xy=True)

    # Transform the original polygon to the raster CRS
    transformed_polygon = []
    for x, y in original_polygon.exterior.coords:
        xx, yy = transformer.transform(x, y)
        transformed_polygon.append((xx, yy))
    transformed_polygon = Polygon(transformed_polygon)

    # Mask the raster with the transformed polygon
    out_img, out_transform = mask(src, [transformed_polygon], all_touched=True, crop=True)
    out_img = out_img.astype(np.float64)/
    out_img[out_img == 0.0] = np.nan

    return out_img
Define the file paths for the red and NIR bands
red_band_file = r’D:\43SCS\43SCS_2023-02-24\S2A_MSIL2A_20230224T054821_N0509_R048_T43SCS_20230224T090324.SAFE\GRANULE\L2A_T43SCS_A040085_20230224T054823\IMG_DATA\R10m\T43SCS_20230224T054821_B04_10m.jp2’
nir_band_file = r’D:\43SCS\43SCS_2023-02-24\S2A_MSIL2A_20230224T054821_N0509_R048_T43SCS_20230224T090324.SAFE\GRANULE\L2A_T43SCS_A040085_20230224T054823\IMG_DATA\R10m\T43SCS_20230224T054821_B08_10m.jp2’
Get the region of interest for both bands
coordinates = [{‘g’: 73.24819412786306, ‘f’: 32.521843540039484}, {‘g’: 73.24819412786306, ‘f’: 32.521843540039484}, {‘g’: 73.24819412786306, ‘f’: 32.521843540039484}, {‘g’: 73.24819412786306, ‘f’: 32.521843540039484}, {‘g’: 73.25105892991965, ‘f’: 32.521843540039484}, {‘g’: 73.25105892991965, ‘f’: 32.521843540039484}, {‘g’: 73.25105892991965, ‘f’: 32.521843540039484}, {‘g’: 73.25105892991965, ‘f’: 32.521843540039484}, {‘g’: 73.25105892991965, ‘f’: 32.52284573593144}, {‘g’: 73.25105892991965, ‘f’: 32.52284573593144}, {‘g’: 73.25105892991965, ‘f’: 32.52284573593144}, {‘g’: 73.25105892991965, ‘f’: 32.52284573593144}, {‘g’: 73.24819412786306, ‘f’: 32.52284573593144}, {‘g’: 73.24819412786306, ‘f’: 32.52284573593144}, {‘g’: 73.24819412786306, ‘f’: 32.52284573593144}, {‘g’: 73.24819412786306, ‘f’: 32.52284573593144}, {‘g’: 73.24819412786306, ‘f’: 32.521843540039484}, {‘g’: 73.24819412786306, ‘f’: 32.521843540039484}, {‘g’: 73.24819412786306, ‘f’: 32.521843540039484}, {‘g’: 73.24819412786306, ‘f’: 32.521843540039484}]
red_band_roi = get_polygon(coordinates, red_band_file)
nir_band_roi = get_polygon(coordinates, nir_band_file)
Calculate NDVI
ndvi = calculate_ndvi(red_band_roi, nir_band_roi)
Print NDVI statistics
print(“NDVI Statistics:”)
print(f"Max NDVI value Rasterio: {np.nanmax(ndvi)}“)
print(f"Min NDVI value Rasterio: {np.nanmin(ndvi)}”)
The results are computed on same polygon:
NDVI Statistics Rasterio:
Max NDVI value Rasterio: 0.6266440390326686
Min NDVI value Rasterio: 0.1268224485719992
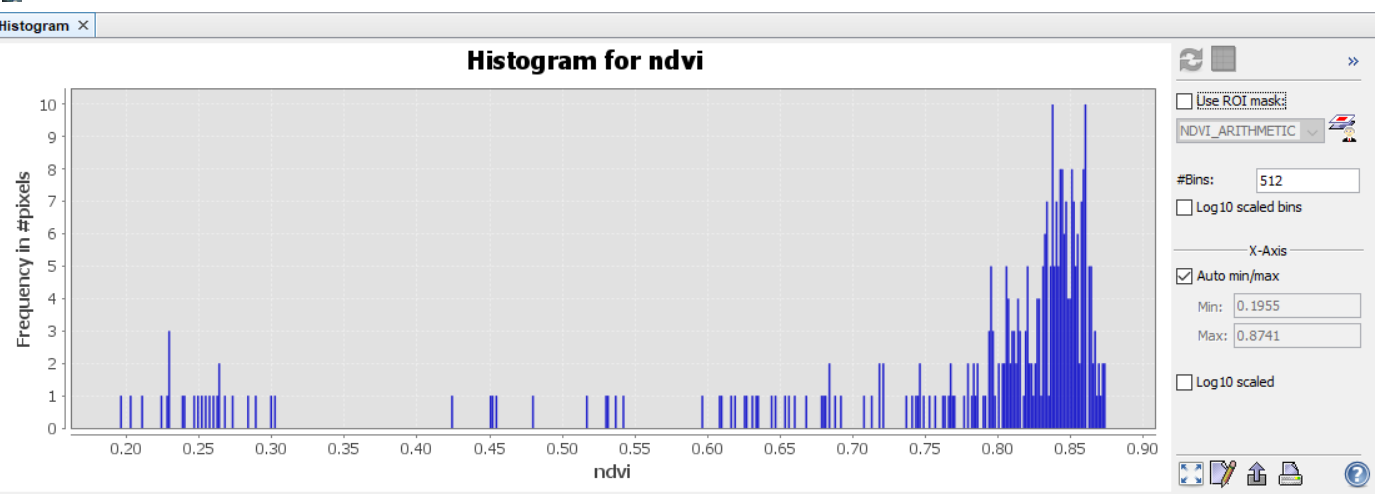
NDVI Statistics SNAP:
Max NDVI value SNAP:0.8740970492362976
Min NDVI value SNAP:0.19548484683036804
Different data readings on Same Raster:
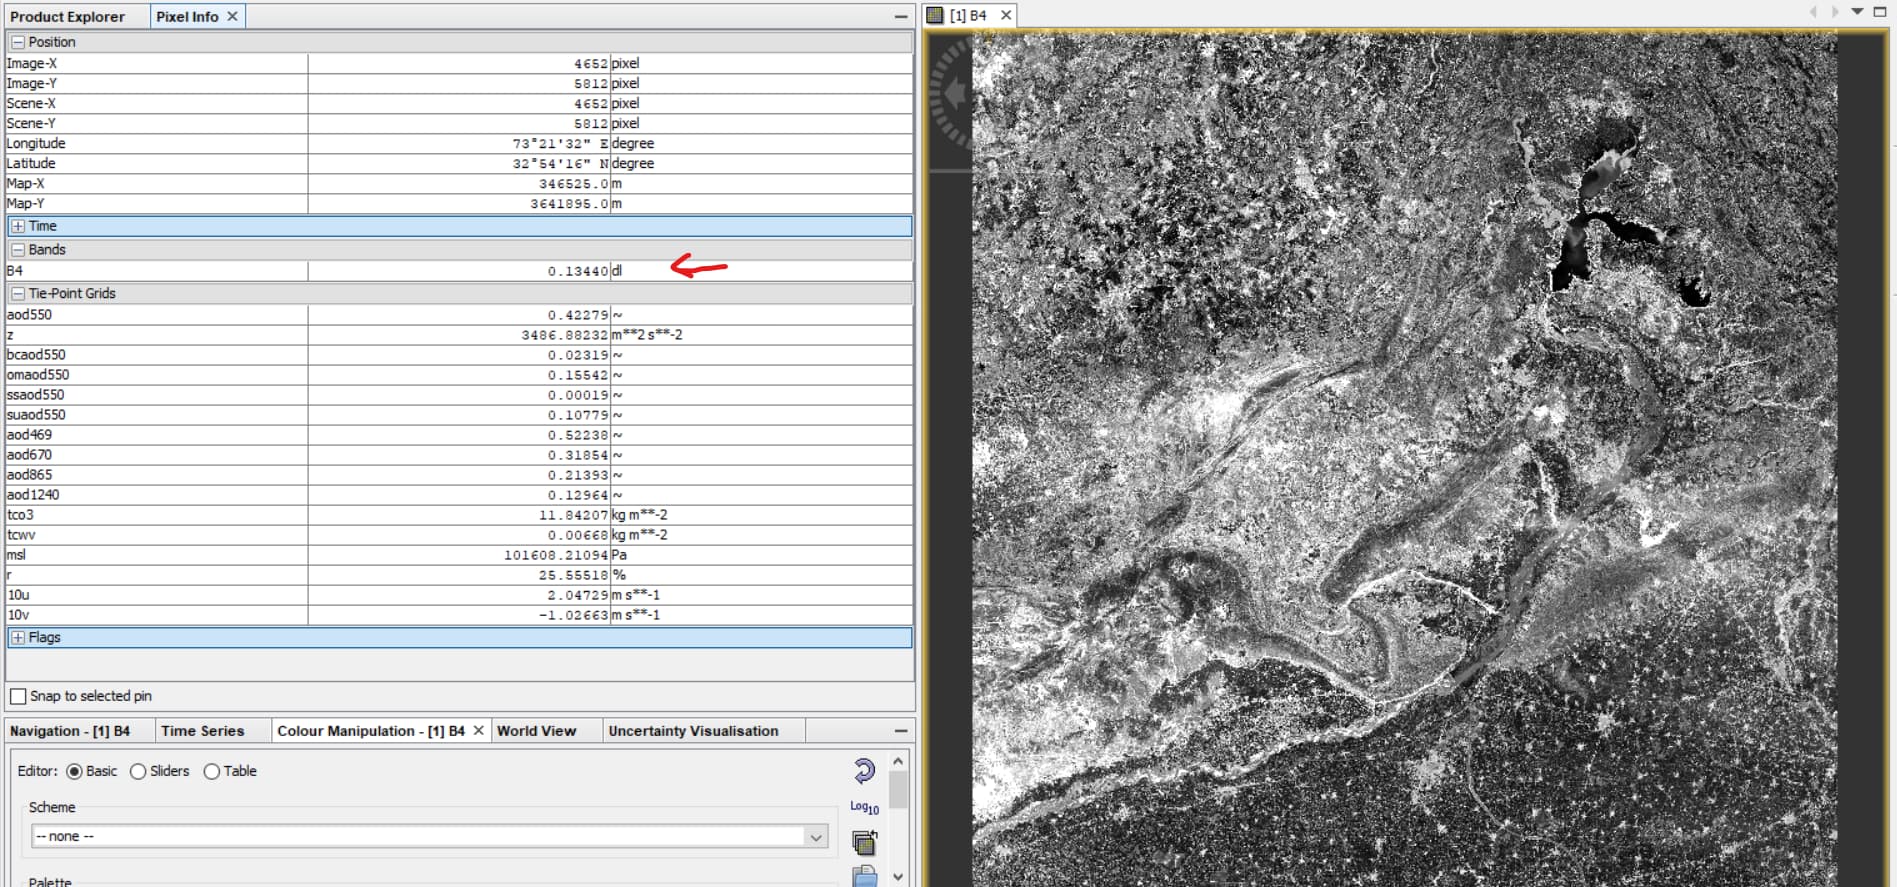
SNAP reading B4 data between 0 and 1 and there is some DL written there I donot know what that is:
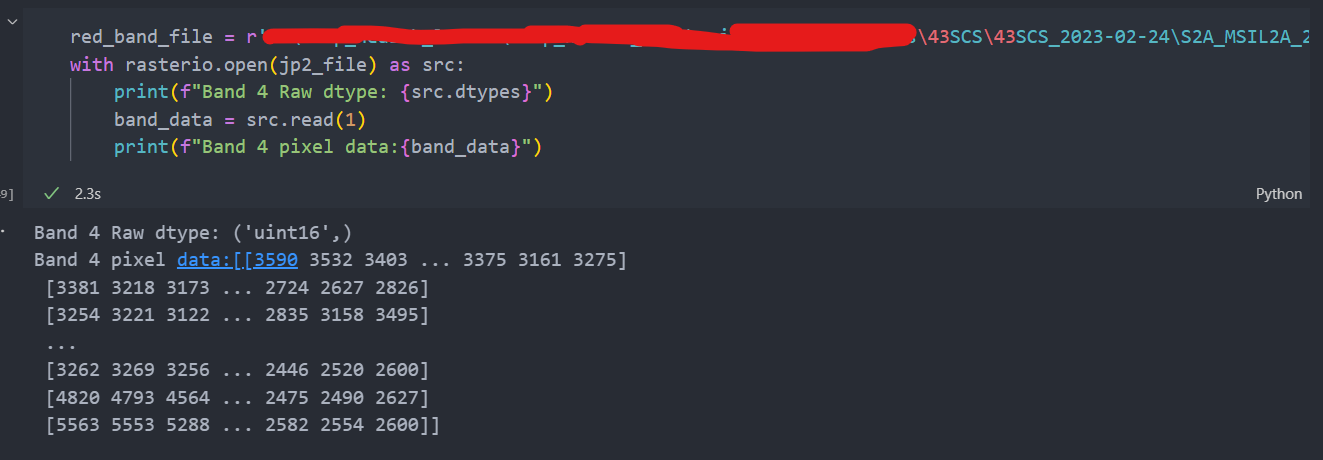
And here is the rasterio reading same band 4 .It shows data type of UINT16