I applied “SNAP NDVI processor” on raw satellite images of Sentinel-2, Landsat-Oli and Aster.
I found differences between the results, whereas, the images represent the same region and the same month.
I would like to know why
Thank you very much
I applied “SNAP NDVI processor” on raw satellite images of Sentinel-2, Landsat-Oli and Aster.
I found differences between the results, whereas, the images represent the same region and the same month.
I would like to know why
Thank you very much
did you use radiometrically calibrated data (bottom-of-atmosphere reflectance)?
Which bands did you select for all three sensors?
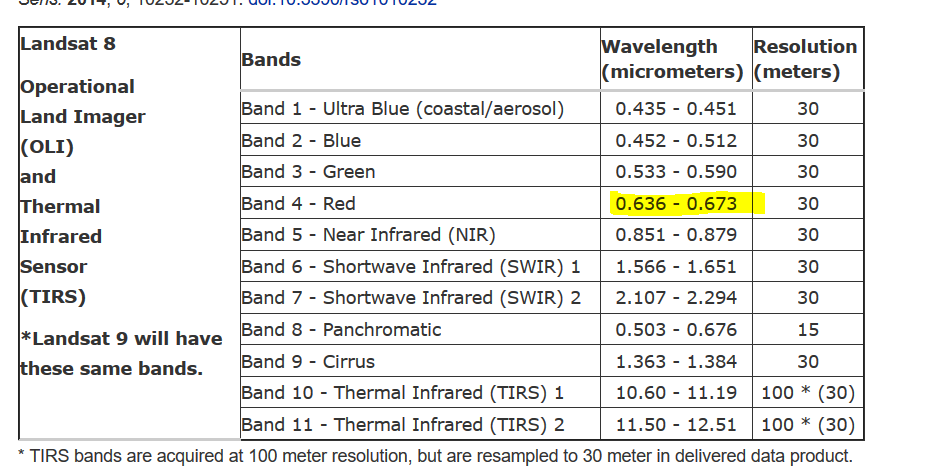
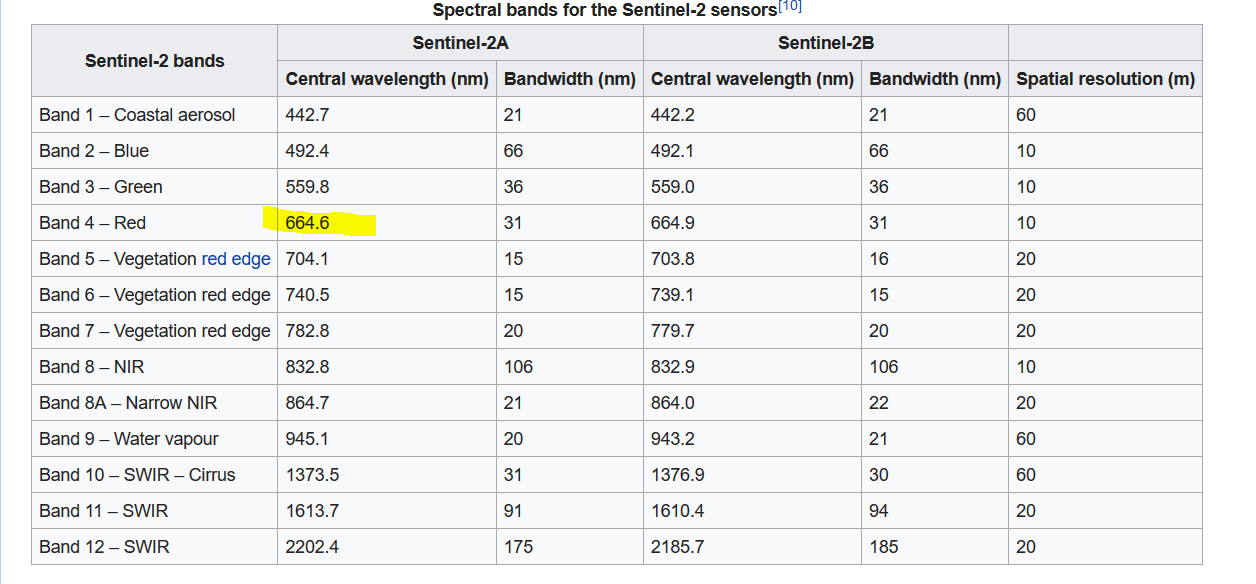
The red and infra-red bands are slightly shifted between the three sensors.
In general the behavior of three diagrams are similar, concerning the differences of minimum and the maximum amount of NDVI, in each of the three curves, comeback to the different of resolutions of three images, ASTER, LANDSAT-OLI, and sentinel-1, the one of ASTER, I’d recommend to recalculate the NDVI,
Also basically the equation of NDVI is, ‘(NIR-red)/(NIR+red)’
the wavelength range of each RED band is different in each three satellite
ASTER
OLI
Sentinel2
Similar thing to the NIR wavelength range,
Dear;
I did not calibrate the images and did not apply any corrections.
There is no problem in the calculations (NDVI formula) I am sure.
I selected the red bands and the NIR bands of each sensor.
With OpenSource softwares, the results are almost identical.
Thank you for your answers
to my opinion, you can only compare images or products of different sensors after radiometric calibration. This brings them into a common unit (and also value range).
Still, the values shouldn’t be as negative as the Landsat8 histogram. This is beyond the differences which are caused by lack of calibration. It must have another reason then, especially when you say that
Are you sure you selected the correct bands for Landsat 8? ASTER and S2 look relatable to me.
Thank you for your reply.
On SNAP, Landsat’s NDVI processor gives a lot of negative values, which is abnormal.
With the other programs (especially OpenSources) the NDVI of the three sensors are identical and the
frequency histograms show a few negative values.
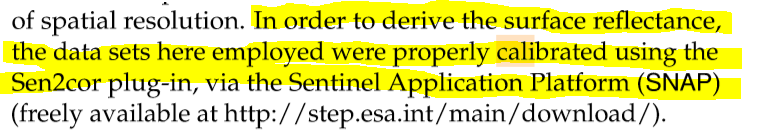
For NDVI, I think that it’s better but not mandatory to apply the atmospheric correction to the images.
On SNAP, we can use ICOR to process Landsat images and Sen2Cor for Sentinel-2 images.
But, I don’t know how to correct Aster images with SNAP.
Best regards
No this is normal, since the NDVI valid range is,
I think it is not supported by SNAP, at the moment, but you could calibrate Aster in QGIS,
the values can only be negative over water areas. Compared to the other two histograms it does look like something went wrong here. But radiometric calibration to reflectance is a good suggestion.
Dear Fakhri;
I did the calibrations with commercial programs, but, the purpose of my work is to make a comparison between three programs including SNAP.
As I answered in the previous post,
You mentioned in your previous post
So which one of your answer we could take in consideration to discuss, also, the main goal of your question was, your doubt bout the differences between NDVI results using different sensors data of the same AOI, and same time.
Please focus on the point of your demand.
Your original question,
Dear;
I apologize if you did not understand my goal. I did not do any calibration when I worked with SNAP, QGis and SagaGis. I worked with raw images to make a comparison between these three “OpenSources”
Best regards
Again, What you mentioned in your previous questions, now is totally difference to your main demand,
Please be very precise in your discussions, because, me and other colleagues in this STEP FORUM, we try up to help each other to gain our goals, Because you mentioned many different things.