In general the behavior of three diagrams are similar, concerning the differences of minimum and the maximum amount of NDVI, in each of the three curves, comeback to the different of resolutions of three images, ASTER, LANDSAT-OLI, and sentinel-1, the one of ASTER, I’d recommend to recalculate the NDVI,
Also basically the equation of NDVI is, ‘(NIR-red)/(NIR+red)’
the wavelength range of each RED band is different in each three satellite
ASTER

OLI
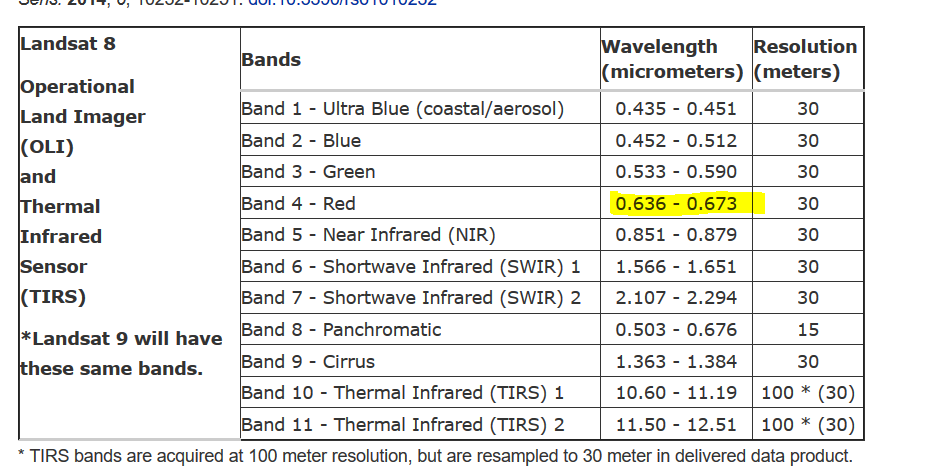
Sentinel2
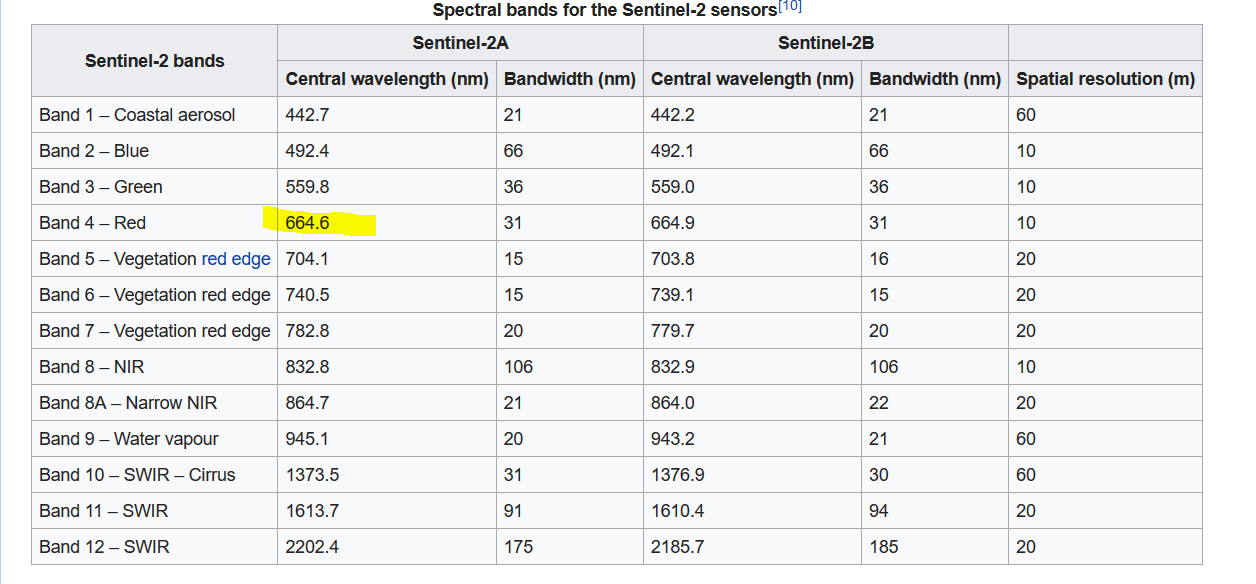
Similar thing to the NIR wavelength range,