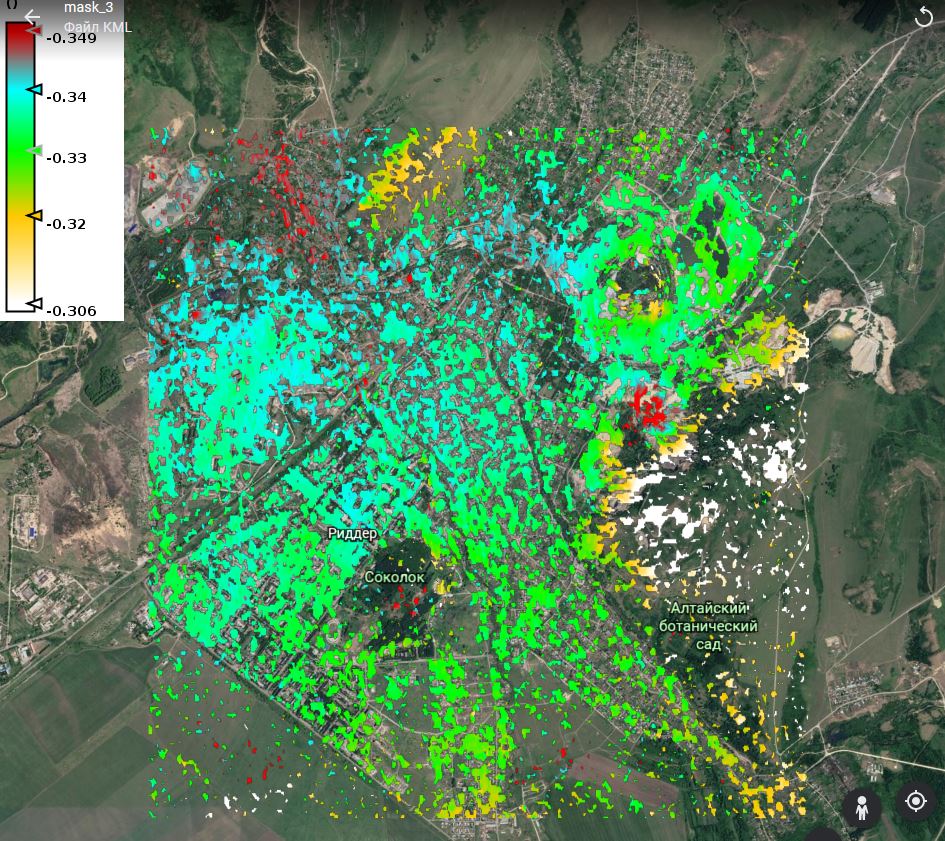
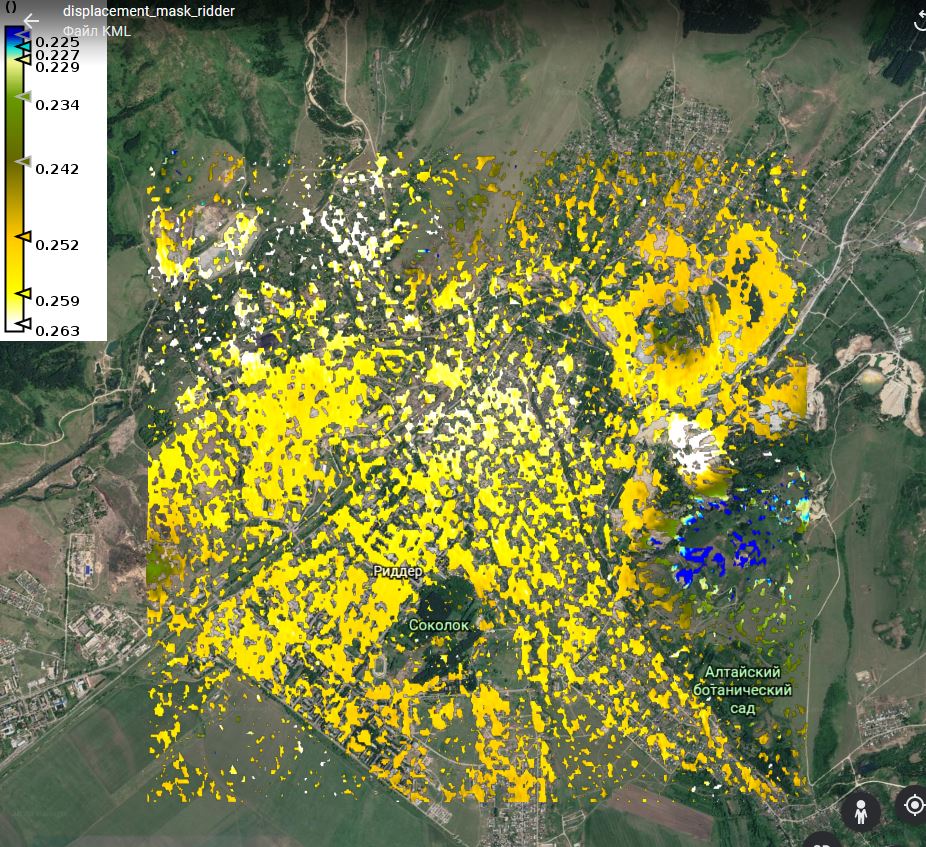
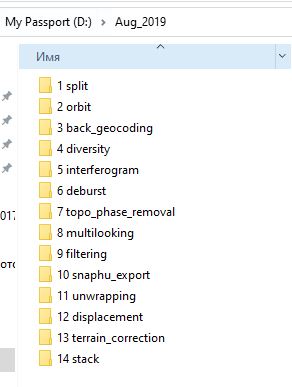
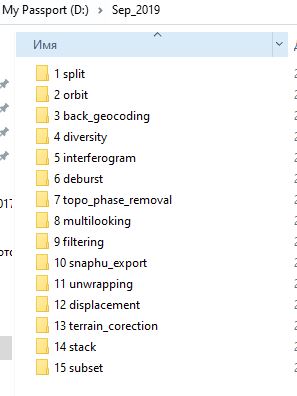
Hello everyone! Right now I am studying land subsidence using by Sentinel-1 sattellite images. But I get different results. I upload in here the steps how I processed sattelite images in the SNAP. In the first pic shows results of displacement in the period of time 20190731-20190905 and second one shows 20190905-20190929. Last pics shows processing steps in the SNAP for each month. In the August I have got negative results after than for September I have got positive results. How do you think, is it truth results or I made some mistakes in the processing of images? Someone can explain these, please? Next what I want to ask that when i have displacement results in there units was meter but after making displacement mask the units was disapeared I hope they are still shows in meter. And last one how can I get general one results like dynamics of displacement just in the one pics maybe like a points? Thanks in advance! I hope someone can helps me!!
I’m not talking about persistent scatterers. In general, DInSAR is a relative measurement. Especially when you compare displacements of different inut products you have to select one area where you assume no change and subtract its value from the displacement raster, so that this area is zero in both results. Only then you can compare if the ranges of both cases really differ.
Please check the tutorial I have linked, it also deals with classic DInSAR, but the result is systematically too high, so this shift is corrected using the Band Maths.
I selected a common images like AB then BC. I have a another question too. How can I choose low coherence value? On what basis should I choose a value low coherence?
compare with your interferogram. Where your fringes look good, coherence is sufficient. Where there is phase noise, coherence is too low. Depending on the type of surfaces, the threshold roughly lies between 0.2 and 0.6
Good afternoon! I used sequentially the sattellite images in the period of time12 days (at Jan to Sept 2020) and got the results as in the image but I still have data from the ground survey. There, the result shows approximately to a min of -1 cm and on sattellite images -4 cm-6 cm. What steps do you think I need to check?
But before you created the sum, the displacement bands could have had entirely different ranges. So it is good to select one point which you use as reference throughout all images and subtract its value from the corresponding date. The sum should then be zero in the aggregated result as well. Only then you can be sure that the images refer to the same relative displacement.
let’s say there is a city in your area where you have field survey data and there is no significant displacement.
Select this point in every image. Because of the relative measurement of DInSAR this point could still be -5, +15, 0 or -1 throughout the images. Now you take these values per image and add them to the result, so this point is really 0 and all other displacements in the image are levelled according to this specific points. Only then you can compare images of multiple dates.