Dear SNAP users,
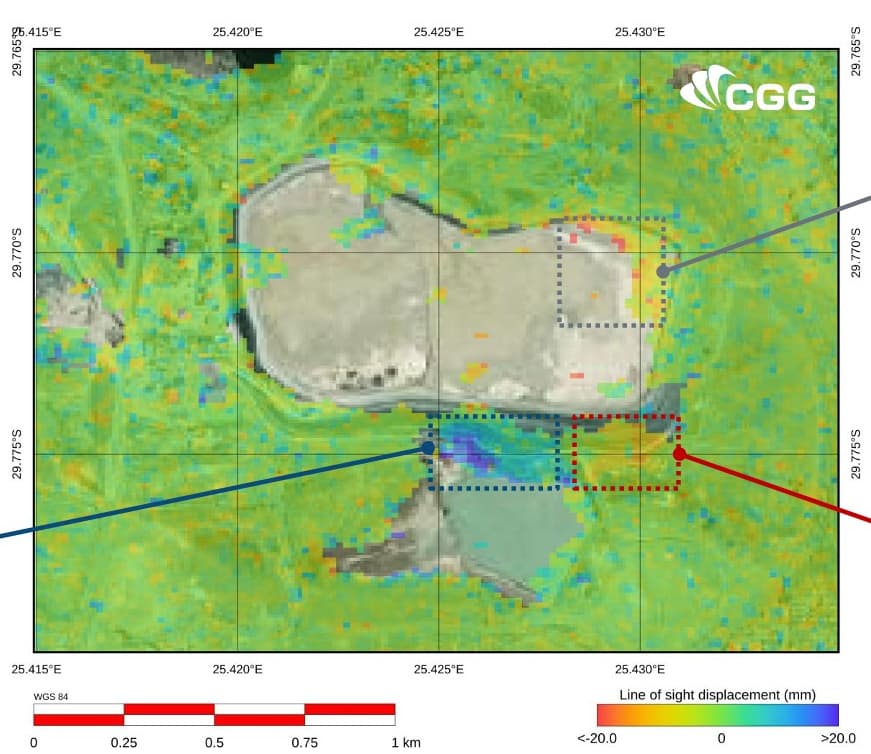
recently I found this displacement calculation for the tailing in Jagersfontein, based on products from 1 and 13 September. These results have great sense and good resolution. It’s a perfect example of the potential of interferometry, in my opinion.
Source:
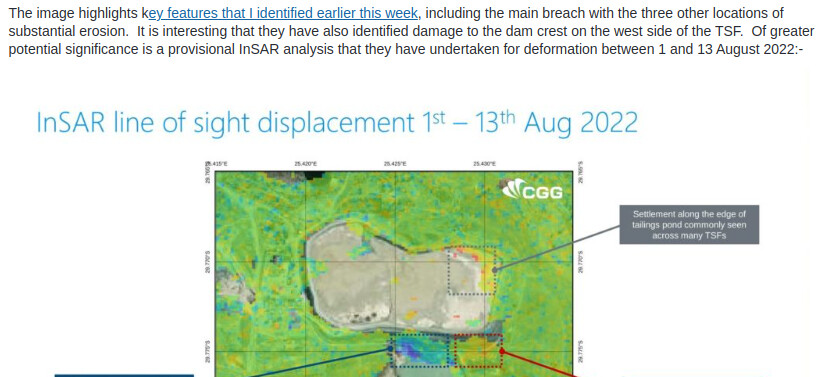
Provisional InSAR data for the Jagersfontein Tailings Storage Facility failure - The Landslide Blog - AGU Blogosphere
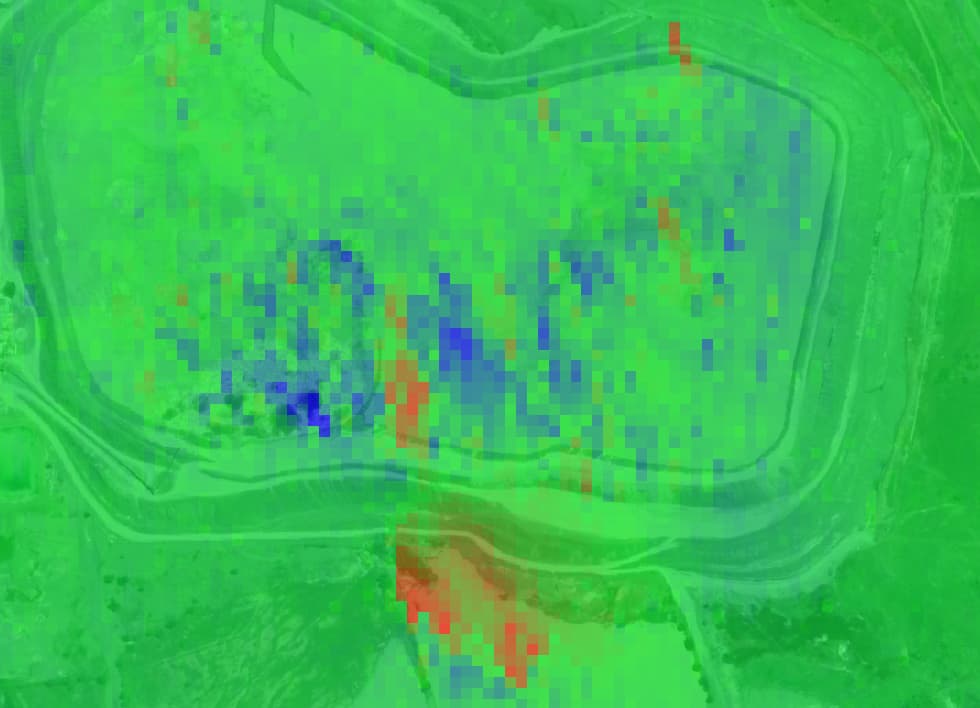
However, I tried to reproduce these results but got totally different values. As long as I used Multilooking with nAzLooks =1 and nRgLooks=1, I got something like that:
RGB scale: -0.03 : 0.03
I got a little better result when nRgLooks = 6, but the values are much lower than in my reference results from CGG. I’m confused about how significant impact has the multilooking processing step. These results have totally different interpretations. Also I am concern these strange strips on the north.
RGB scale: -0.0162 : 0.00
What may be the reason for the differences between my study and the CGG study?
What could be the cause of the stripes in the north?
I tested different DEMs and parameters, but I still got very similar results. The only thing which I think is an atmospheric correction. Is it possible?
It is very unlikely that what is included in the article came from a single interferogram. In all likelihood, it was generated from a time-series analysis as this would clean out the estimates significantly, as is usually almost always done for such small deformation signals. Single interferogram analysis is usually only used for really large deformation events like earthquakes or volcanic eruptions.
But on the print screen and in the description there is information that the result was obtained based on 2 products only. There are also informed that for the previous pair of SLC product, subsidences was very similar.
It doesn’t say anything specifically about number of SLC products. It’s fairly easy to do difference of estimates between epochs once you have a time-series.
To be sure: if I have a time series analysis I can compare pair products and will get different results than after processing the same pair of products independently of others (without time series analysis)?
Correct. The differences depend on the details of the time-series method implementation like temporal filtering, spatial filtering, phase unwrapping, point selection, dem error correction etc.
Would like to follow up with you on the "strange strips in the north " you may have mapped a zone of vibration influence from the deteriorating pit…its escalating breakback has generated documented vibrations back to to 2007. We at Word Mine Tailings Failures have been concerned about the stability of the western TSF REINET in the vicinity of recurring vibrations. Would appreciate your follow up at compiler@worldminetailingsfailures.org.
Additionally there are two fault lines running through the pit that we haven;t yet been able to overlay.
With respect to the CGG, that was not a long term analysis. We have been working with an InSAR team who looked at all three tailings structures over a much longer time frame up to failure ( the original DeBeeers in the middle still holding some materials and the two Reinet additions east and west designated for thickened ( average pre thickened size 0.5mm)clayey re-mining fines. Over this longer time frame all three break points show a simultaneous deformation of 90mm at about the same time18mos-20 mos pre failure thereafter all accelerating rapidly together. Your work and CGGs much shorter time frame does clearly identify evolving pre failure deformation in the buttressed wall section where two of the three breaks manifested.
The third break is at the southeast corner of the post 2012 Reinet constructed upstream TSF. Our InSAR shows bi directional movement in both raises from the toe to the crest.
We have quite a compilation of InSAR analysis on Jagersfontein that may begin to define an early warning signal at that 90mm deformation marker after which there is rapid acceleration.
Interested to start a working group on these any Jagersfontein InSAR’s and pull them together into a coherent analysis of how InSAR could be used with other data and analysis to establish a data informed intervention call.
1 Like