Greetings everyone,
I’ve recently delved into using SNAP after following some excellent ESA tutorials. However, my primary focus lies in the realm of long-term time-series DInSAR analysis. But this typically thrives on a 12 to 36-day interval for optimal result. This translates to the need for hundreds of processes to cover just a few years of monitoring – a level of complexity that extends far beyond the scope of most tutorials.
I’d like to pose a few questions and share some concerns, and I would greatly appreciate any insights or advice:
-
Question 1: Could you kindly share your prior experiences or workflows related to long-term time-series DInSAR? What challenges did you encounter, and how did it turn out?
-
Question 2: It seems that I’ll need to employ automated batch processing to handle the multitude of analyses required. Thus far, I’ve successfully processed the “Phase to Displacement” step to generate “displacement_vv” and exported it as KMZ files for visualization in Google Earth. However, resulting in hundreds of KMZ files for sequential long-term period comparisons doesn’t seem useful at all. What is the typical end result data format for long-term time-series DInSAR? Is it a fancy map, raster, DEM, CSV file or something else?
-
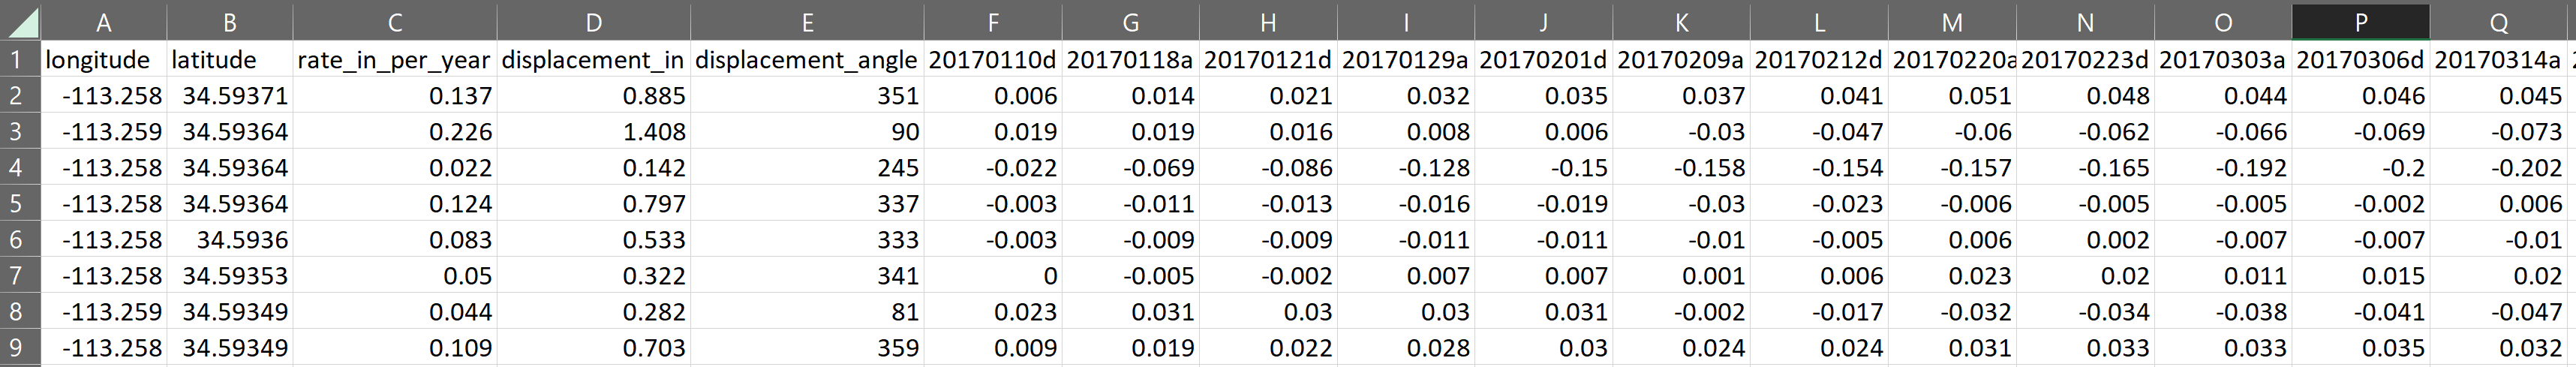
Question 3: I stumbled upon a sample DInSAR dataset processed by a InSAR company (image below). Is there a way to obtain a similar end result? This CSV dataset provides a collection of GPS points and their displacements over a span of 5 years, with readings every 12 days. This seems very easy to export to GIS software and generate a fancy map.
Thank you all for your time and consideration.