Display range in SNAP

Dear all,

I have a question about ‘display range’ in SNAP;

I used ‘band math’ for doing some processing and finally, I got a image and ‘display range’ shows me that range is between (min: -2.734, max:7.072); look at below image (figure 1):

display_range
Figure 1. Display range.

but when I used ‘arrow’ on image, I found pixels that they have amounts like (-4.23262); look at figure 2;


Figure 2.

This looks strange because I thought minimum range is (-2.734) based on ‘display range’.

Would you please let me know how can I find minimum and maximum in SNAP?

Thanks

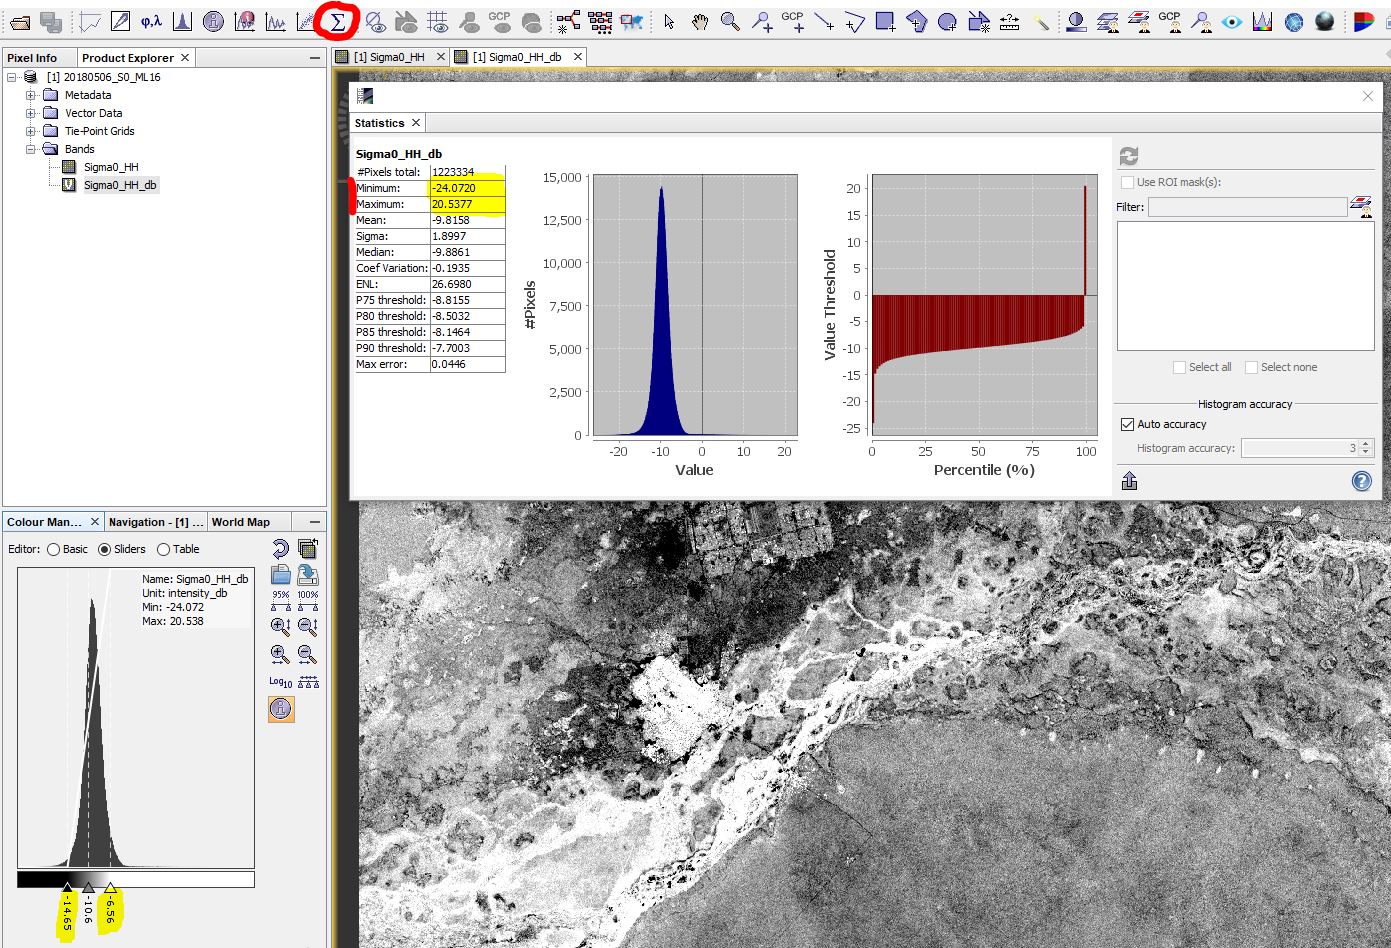
SNAP initially reduces the range for the colour bar to 95% of the full range: Differences between image without and with 95% or 100%
This is done to increase contrasts for the sake of visualization.

Accordingly, the values displayed in the color manipulation tab are not the real minima and maxima of the images.

You can use the statistics tool to get the absolute measures:

Thanks. It works.:slightly_smiling_face: