Dear all,
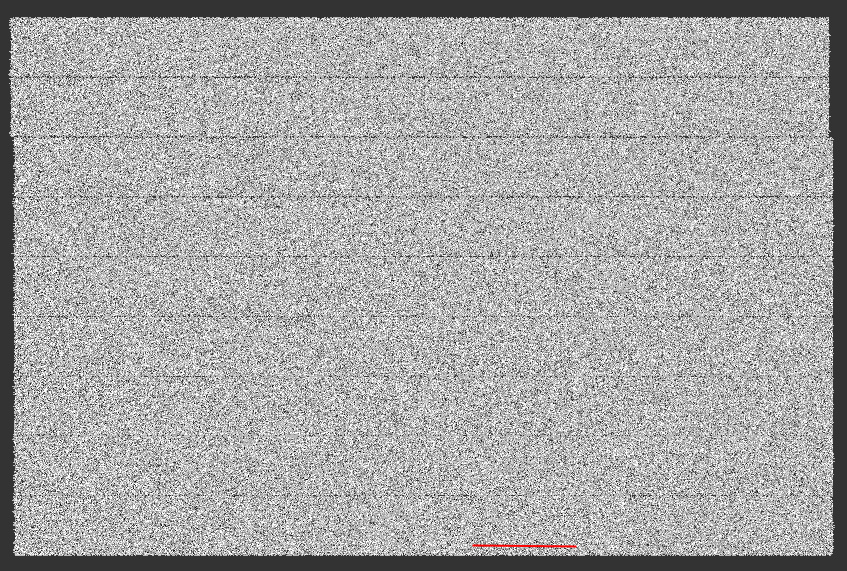
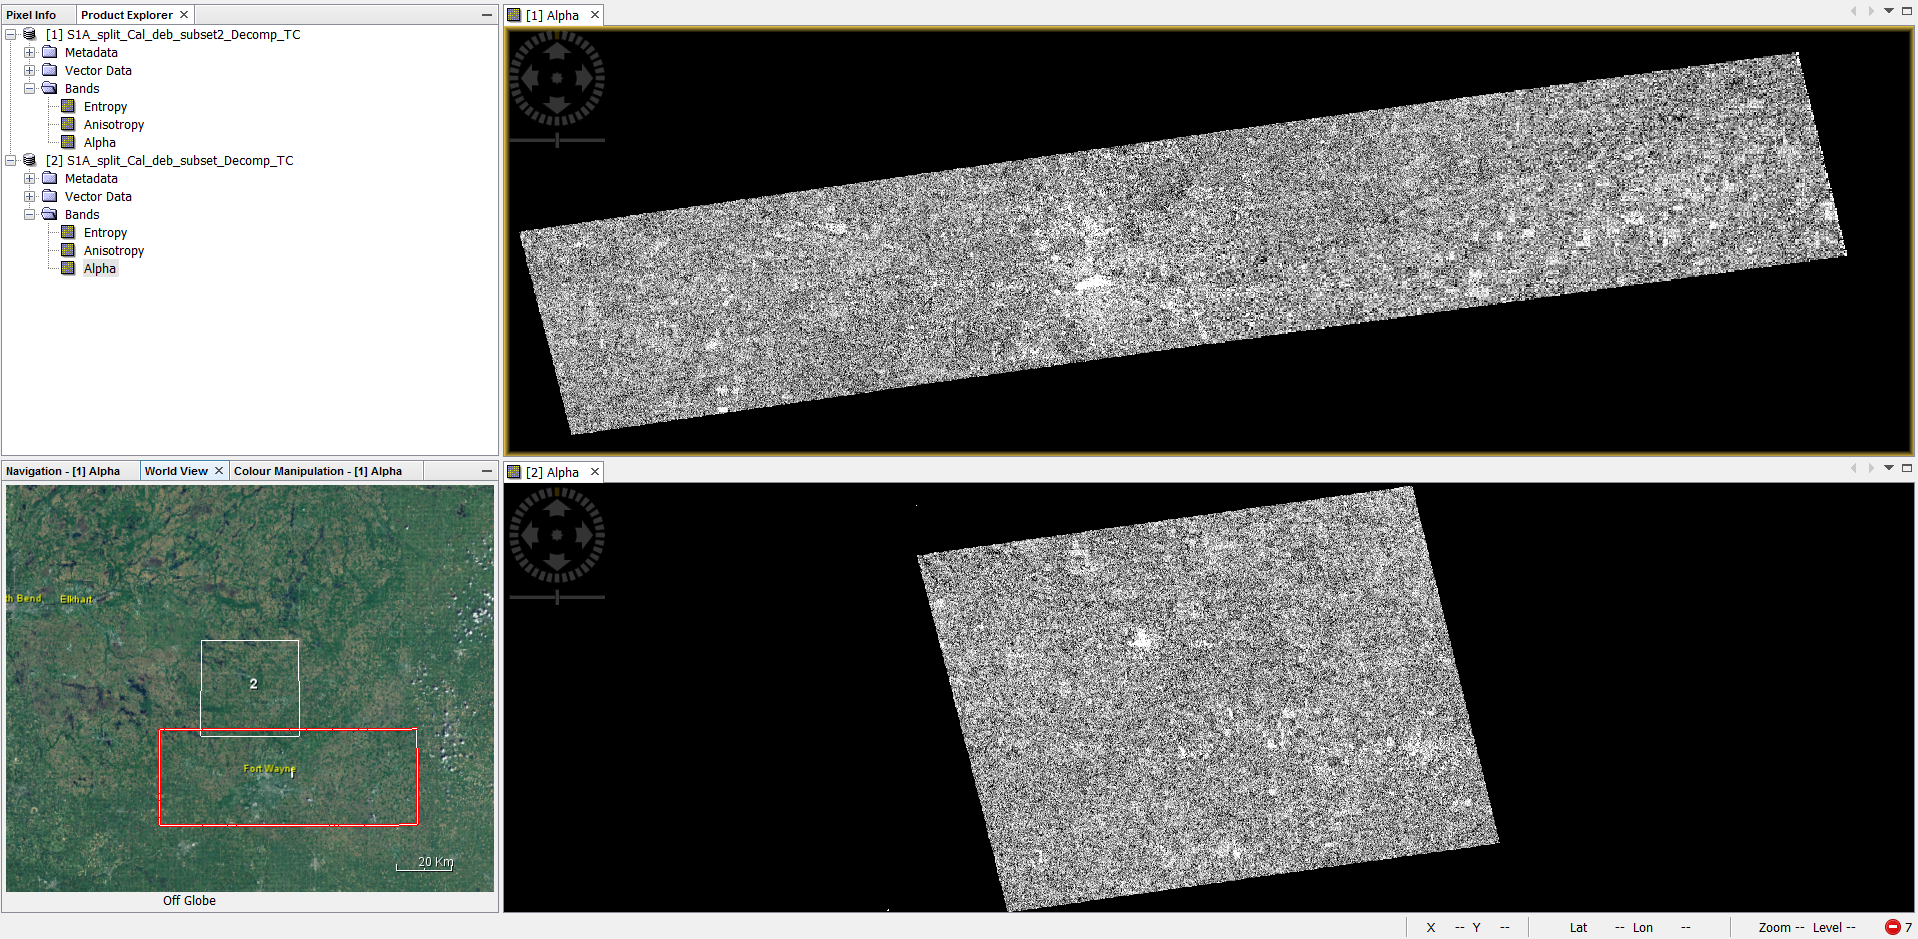
Could someone tell me why the image looks split in two parts (one dark and one bright) ?
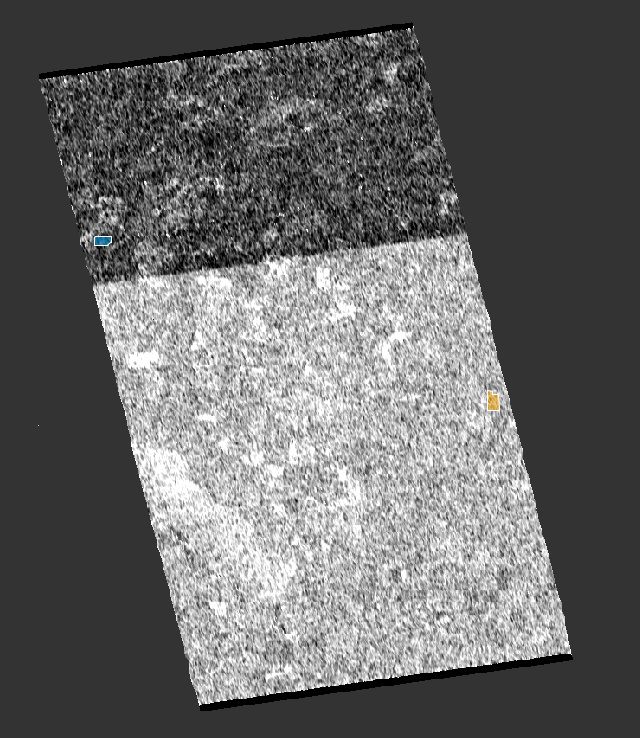
The image attached is about the Alpha decomposition.
Thank you so much.
Piero
Dear all,
Could someone tell me why the image looks split in two parts (one dark and one bright) ?
The image attached is about the Alpha decomposition.
Thank you so much.
Piero
What data are you using? Can you tell us how you processed it until this step?
I’m using S1A IW SLC 1SDV and the steps I follow are:
1)Split
2) Calibration (complex)
3) Deburst
4) Subset
5) Speckle (x2)
6) Dual Pol Decomposition
7) Terrain Correction
the straight line indicates that the parts of the image have been handled differently at some step. Can you run the steps without debursting and see if the change occurs at the edge of the different bursts?
Lower alpha values generally indicate dominant surface scattering over volume scattering, such as caused from vegetation for example. But in this case the edge is too sharp to have its cause in different landuse.
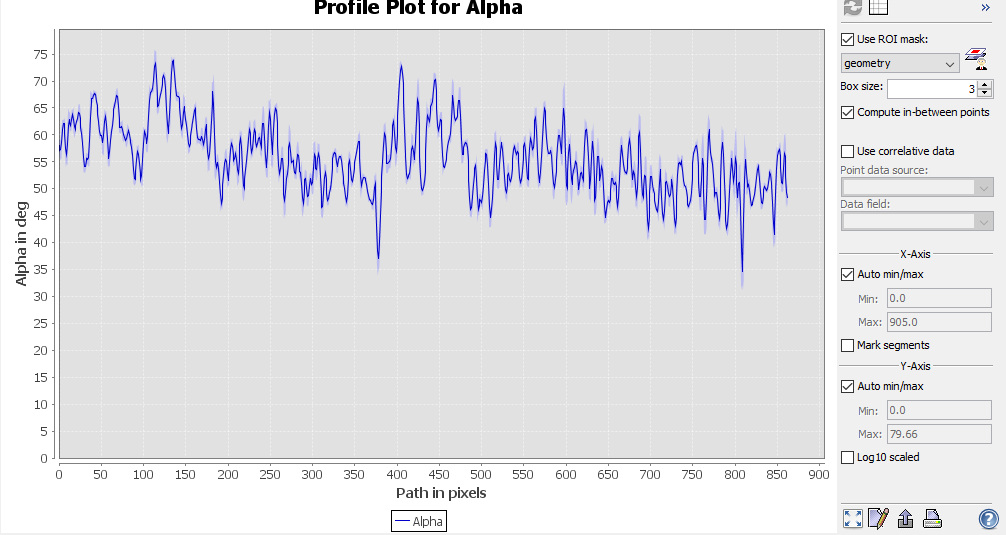
You could also draw a line perpendicular to this edge and plot a profile to see how much alpha increases (ranges between 0 and 90 degrees). This doesn’t solve the problem but could give us a clearer hint what went wrong.
OK I’ll try without deburst first.
Well, I can’t continue with the processing if I don’t do the deburst first! 
Is it possible to skip 3, 4, 5 and directly perform the decomposition?
As decomposition also uses windows of several pixels, speckle filtering might not necessarily improve the results.
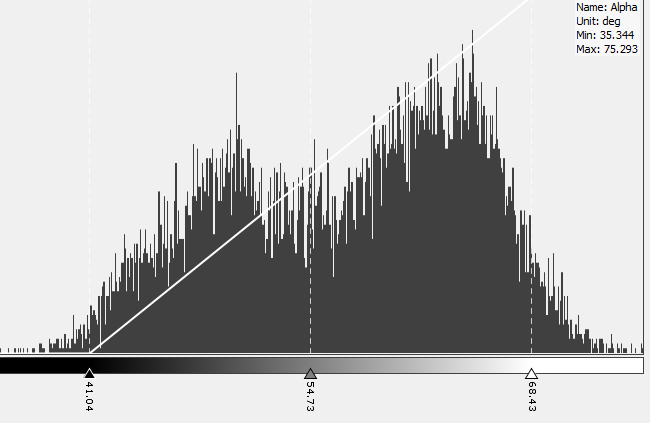
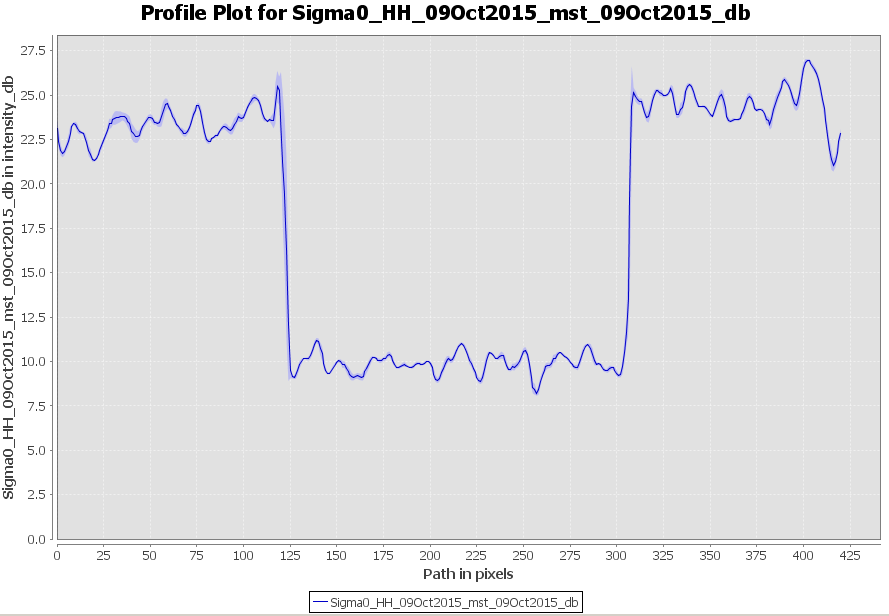
this is a profile of a rectangular perpendicular to the edge
No, the deburst is always requested
if you investigate the edge - maybe by creating a vector along the line (and importing it into the debursted image) - do the edges of the bursts coincide with the change of alpha?
Instead of a histogram, a profile plot would maybe give more insights:
![]()
like this, for example:
I meant the profile perpendicular to the edge so we can see the “jump” in alpha values.
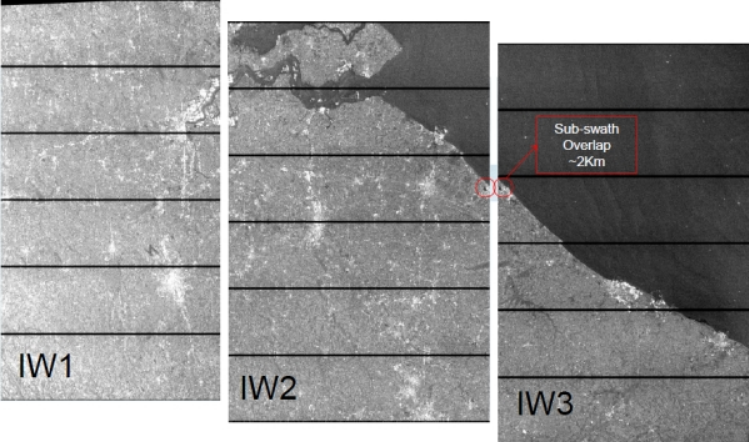
The second thought was that maybe this edge is at the border between two bursts:
You could check that by drawing a line along the edge in a GIS, then import this vector into the product before debursting (step 2). I would expect this line to be in the black area between two bursts.
so it is not related to the borders of the bursts.
Can you send me the name of the product so I can test it?
Sure
S1A_IW_SLC__1SDV_20160717T233209_20160717T233236_012195_012EC6_8F13
I repeated the steps from above:
1)Split
2) Calibration (complex)
3) Deburst
4) Subset
5) Speckle (skipped that)
6) Dual Pol Decomposition
7) Terrain Correction
I am not sure if I completely matched the subset (tried to areas) but didn’t experience any edge in the alpha angle image.
Maybe you can also try skipping the speckle filtering step and see if it persists.
Oh that’s great! I’ll try without speckle. Thank you!
nothing, it still persists… anyway, what swath and burst did you choose ?
IW1, bursts 1-3