FORESTS GDR S1.docx (3.0 MB)
Hello everyone,
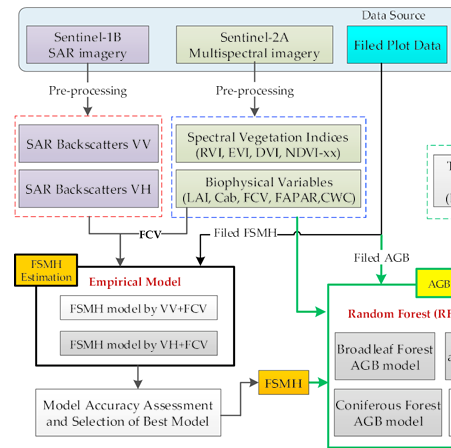
I need help to understand what kind of elaborations i do to obtain SAR Back scatters VV and VH images that is used in this paper to obtain FSMH model. someone can help me?
FORESTS GDR S1.docx (3.0 MB)
Hello everyone,
I need help to understand what kind of elaborations i do to obtain SAR Back scatters VV and VH images that is used in this paper to obtain FSMH model. someone can help me?
If you apply Calibration to Sentinel-1 images you get the backscatter coefficient Sigma0.
Please also have a look here: What is sigma0
Maybe this also helps you: Radiometric & Geometric Correction Workflow
Thank you for reply ABraun,
now I’ve another question for you. If I have two or more GDRH images in different times, but with small difference time between them, to link them to obtain a single product that is more accurate: what kind of elaborations I do? I have to elaborate single images, like in the workflow you suggest me, and than apply an interferometry or I have to link them before elaborations and than apply the workflow you suggest me?
Thank you for all
I’m not sure if I undestand what you mean with this.
Sorry, I try to explain,
I understand that when I elaborate a single image, that image can be have some errors that is respresents by shadow zones or other kind of distorsion of the image. Instead, when I use a serie of images, and link them to correct errors, a single pixel of the final image have a medium value among all pixes of all images that I use for that multitemporal correction (for example when I apply a multi-temporal speckle filter). Isn’t it a way to get a more accurate image? Sorry, I’m a student,and it’s my first time with the Sentinels-1 images and SNAP program.
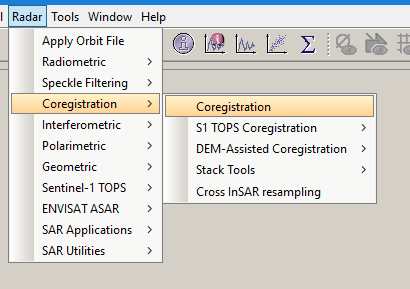
if you create a stack of your images (after pre-processing) and then use
Radar > Coregistration > Stack Tools > Stack Averaging
you can create a mean image of all the inputs. Would this help you?
Yes ABraun, thank you,
now I’ve 4 S1B_IW_GDRH_1SDV images, I want obtain a SAR backscatters, VV and VH, like in the paper I posted. I’ve set this workflow, please tell me if is correct for you
For all images I apply:
now I want to proceed with speckle filtering, I have to use multi-temporal speckle filtering and than, after apply doppler terrain correction, use coregistration or I have to use single product speckle filtering and Doppler terrein correction for all images and finally use coregistration?
if you want to perform multi-temporal speckle filtering, you have to create the stack first (by coregistration).
You can then terrain correct the entire stack as a single product.
Hi everyone,
I resume this conversation because I started again to work at this project. I hope this isn’t a problem. After this elaboration:
-S1 thermal noise removal
-Apply orbit files
-Calibration in sigma0 and beta0
-Radiometric terrain flattening
-Create stack (4 images)
-Multi-temporal speckle filtering
-Range dopple terrain correction
I obtain 4 images like this:
then i do Stack averaging (mean average) to obtain a single product but the result is this:
Like you can see the image is doubled or not perfectly superimposed
Why? How can I solve it? I need to obtain an hight resolution image to have a good final result and continue the elaborations.
Thank you for all
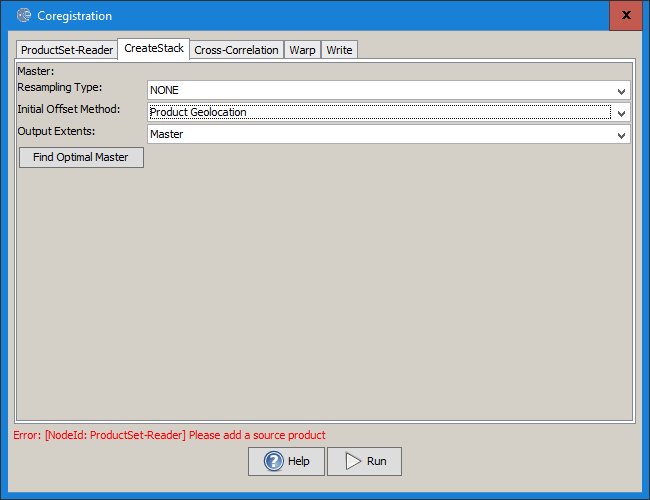
instead of “Create Stack” you should use the “Coregistration” operator to stack the S1 images. Use “Geolocation” as initial offset method (instead of “Orbit”), because they are already geocoded. The coregistration then refines the geometry of the slave images to match the master image best possible.
ABraun thank you for reply,
but I don’t understand very well what you mean. I’ve create stack from: coregistration --> stack tools -->create stack, there is another method to create a stack? And than what you mean when you say use geolocaltion as initial offset method (radar–>geometric–>ellipsoid correction–> geolocation-grid?? use this function instead of “Apply orbit files”?). If you have time please explain all steps.
thank you
There is a module called coregistration which offers to set this offset method.
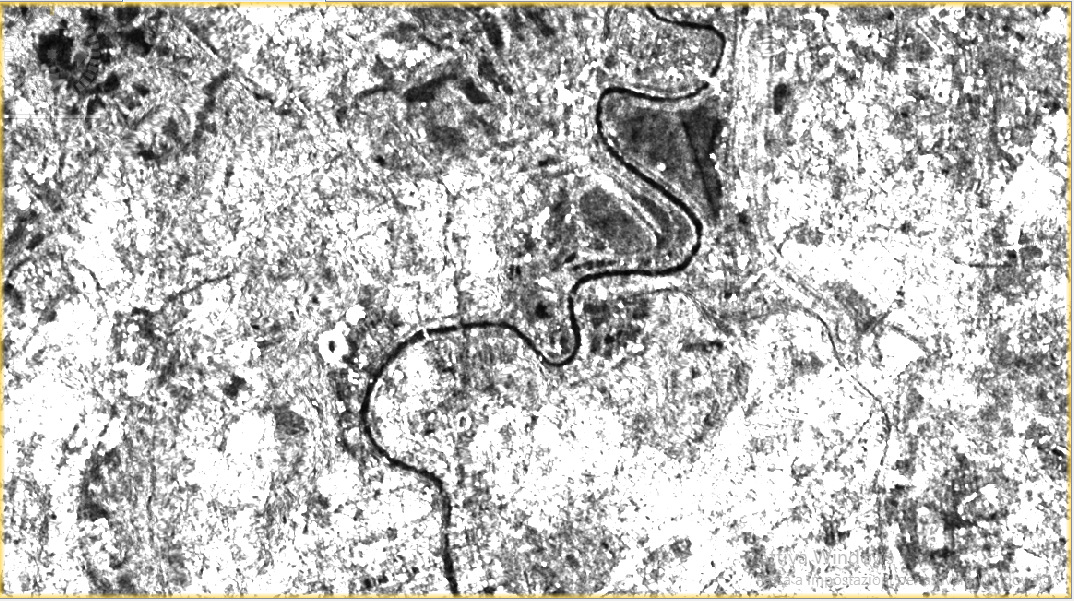
Hallo ABraun, I came back to the S1 datas because during the elaboration I’ve notice that there isn’t a good correlation (R2 statistical index) between GDR_VH and VV images and Lidar height model (resampled from 1m to 10m) that I have about my study area.
VH_CP.pdf (502.5 KB) Lidar_CP.pdf (537.0 KB) 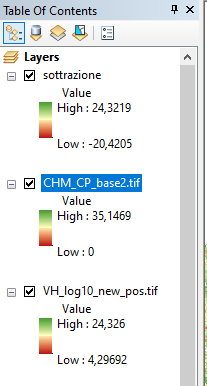
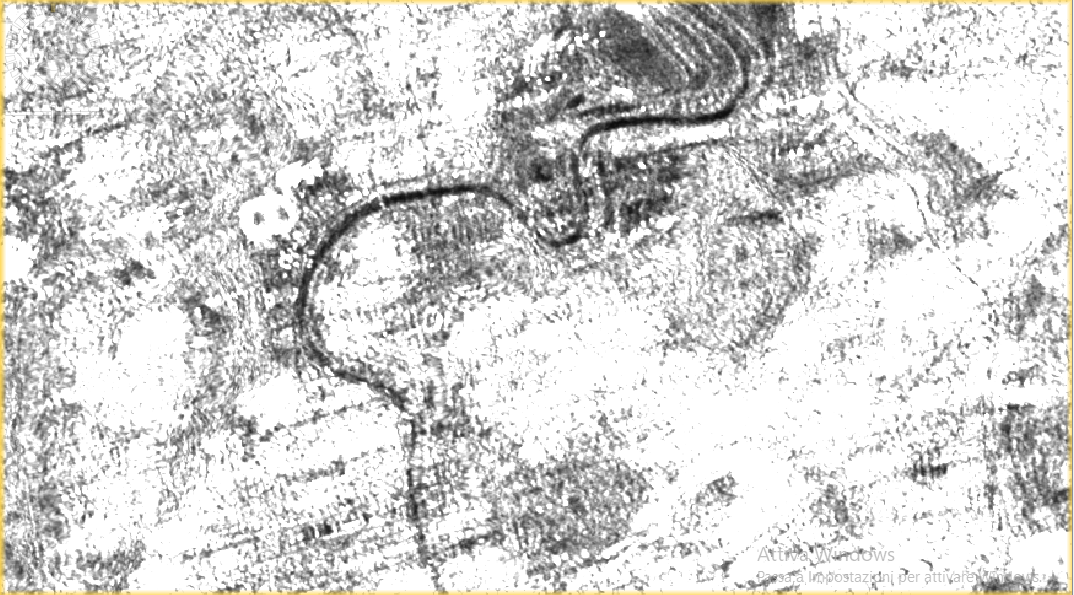
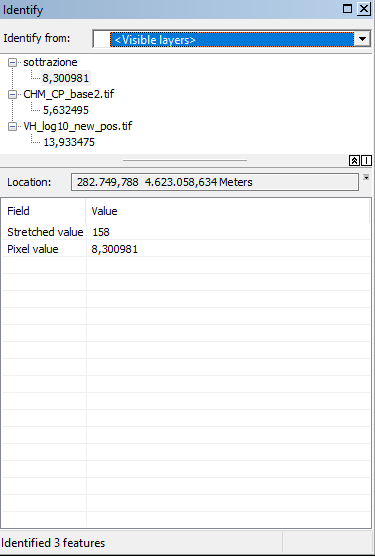
Like you can note there is a big differences. “Sottrazione layer” is the difference between GDR img. and Lidar image.
sottrazione.pdf (534.6 KB)
the GDR data is spatialized as if it were an average value and cannot capture the exact differences on the ground. in fact the biggest difference with the Lidar data are found in the portions of the territory where the heights are very low or very high.
now I would like to know if this problem can be caused by the application of the speckle filter, in particular in the use of the lee sigma filter. So I would like to know if by applying another type of filter I can get a better result, but not knowing the other filters I would like some advice from you which could be the best. Or do you think it is better not to use the speckle filter?
another problem is that I don’t have a statistics program that allows me to perform multivariate regression analysis (with logarithmic curve), in fact the obtained R2 is based on linear multivariate analysis. So I wonder if applying the right curve the result can change a lot. Furthermore, in this way I have no way of applying the mathematical model described in the article (which uses the Auto2Fit program) at the beginning of this conversation for the calculation of the FSMH. So I ask you if you know a free statistical program dedicated to multivariate analysis (for now I’m using Past318, and trying ERRE).
thank you.
Speckle filtering is always a good option if you are working on areas, e.g. forest cover.
But it sounds like the variation of one Sentinel-1 layer does not really reflect the changes in forest height.
You could extract the values of LiDAR and Sentinel-1 (bands and combinations, maybe also texture) to a text file.
Orange is a nice tool for multivariate prediction of a target variable (here forest height):
You could either do this by regression or classification (average height)