I’m trying to despeckle Sentinel-1 data in Envi 4.7 (Radar - Filter- Adaptive filters - Enhanced frost), but for two additional parameters (Cu, Cmax) I need ENL. In the technical description of ENVI Adaptive Filters (http://www.exelisvis.com/docs/AdaptiveFilters.html#Frost) i hand’t found, what values of Cu, Cmax I could receive from calculation. How could I compute ENL from GRD product ?
ENL depends on the processing, see:
How could I compute ENL from GRD product ?
The theoretical ENL values for the various S1 GRD products can be found in Table 5-1 (p 5-2) of the S1 product definition document found at https://sentinel.esa.int/documents/247904/0/Sentinel-1+Product+Definition+V2.6. If you wish to measure the ENL yourself, you need to select a large uniform region (that is not close to the NESZ of the product) and measure the mean and standard deviation of the intensity of the region. Then ENL = mean^2/std^2. Note to calculate the ENL you need to square each pixel DN value of the region before calculating the mean and standard deviation.
1 Like
If ENL of the data is predefined (for sentinel 1A data in IW mode given as 4.4) what does it mean to calculate ENL of the homogeneous region and what does it give? Also, I didn’t understand the concept of Multilooking. Will it give square pixel or is it to remove speckle noise?
Sorry for my dumb questions. Please help me to understand the concept.
Hi, the ENL can be calculated theoretically by using the total azimuth bandwidth and the number of independent number of looks (i.e. by splitting the total bandwidth into N separate looks which may or may not be overlapping). The ENL can be measured using homogeneous regions in imagery and compared with the theoretical ENL - any differences could indicate a problem with the processing.
The visual impact of performing multi-looking can be seen in Fig 5 of this excellent SAR tutorial: http://www2.geog.ucl.ac.uk/~mdisney/teaching/PPRS/PPRS_7/esa_sar_tutorial.pdf. This shows that the impact of speckle is reduced with multi-looking but at the expense of worse spatial resolution.
So multi-looking is used to reduce the impact of speckle but it also means that the spatial resolution in azimuth and ground range become similar in size which leads to a square pixel size in the output image.
1 Like

Thank you very much. Awesome explanation. The answer I have been looking for so many days. But again, why we are going for speckle filtering on multilooked data (GRD data).
I have another doubt. I have calculated the ENLfor 4 different regions (1024*1024 size) in the same image. I got ENL values as 0.7682,1.2080,4.3982, 0.2921. Does that mean the regions I took are all not homogeneous? If so, the image that has a value of 4.3982 (nearly equal to 4.4) is showing bimodal histogram. What do different ENL values for different image indicate?
Thank you for the link.
Hi Sam,
But again, why we are going for speckle filtering on multi-looked data (GRD data).
Multi-looking cannot be used for SLC data as the phase information would be lost (since the images generated from each look are incoherently summed to form the final image). It would be possible to generate a GRD product without multi-looking but the pixel size would be quite different in azimuth and range and would not be compatible with other sources of satellite imagery such as optical imagery from Sentinel-2.
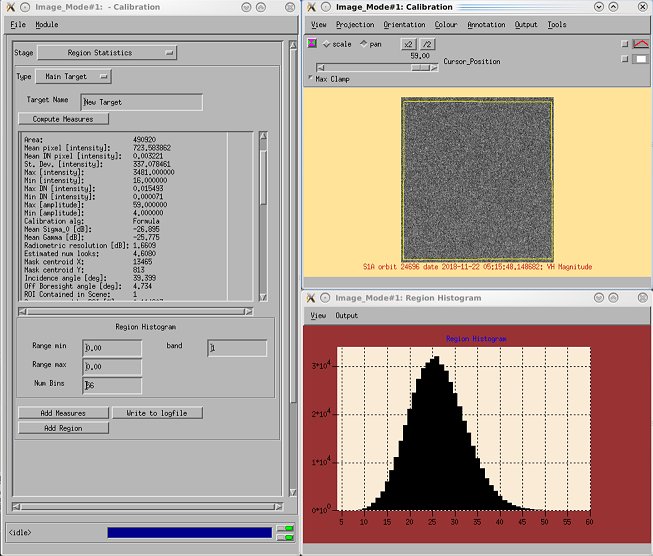
Measurements of ENL from S1-A and S1-B can be found in Section 5.1.3 of the 2018 Annual Performance Report (https://sentinel.esa.int/documents/247904/3406423/Sentinel-1-Annual-Performance-Report-2018.pdf) . This shows that the ENL has a values of ~4.7 for GRDH products. The equation to calculate the ENL is mu^2/std^2 where mu is the mean intensity for a homogenous region and std is the standard deviation. It is important that this calculation is performed on the intensity version of the image, i.e. where every pixel is squared before using the equation. Note that low sigma0 regions which are close to the thermal noise should not be used as homogeneous regions. The image below shows an example ENL region and calculation (note the histogram is of pixel amplitudes rather than intensity).
Perhaps you can check you are calculating ENL correctly as for GRDH products ENL should be close to 4.7 and the pixel distribution should look a bit like that below.
1 Like
 Thank you.
Hi,
i am trying to despeckle the Sentinel-1 image using filters with MATLAB coding. ENL value I am getting as 0.0025 for the GRD product and after application of filter…the results are 0.0051,0.0021,0.0069,0.0053,0.0045 with different filters with the formula ENL=mean^2/std^2
i am trying to despeckle the Sentinel-1 image using filters with MATLAB coding. ENL value I am getting as 722 for the GRD product and after application of filter…the results are 9212,9314,842,8721 with different filters with the formula ENL=mean^2/std^2 by dividing the selected region into 25x25 block size.
Can anyone help me on this