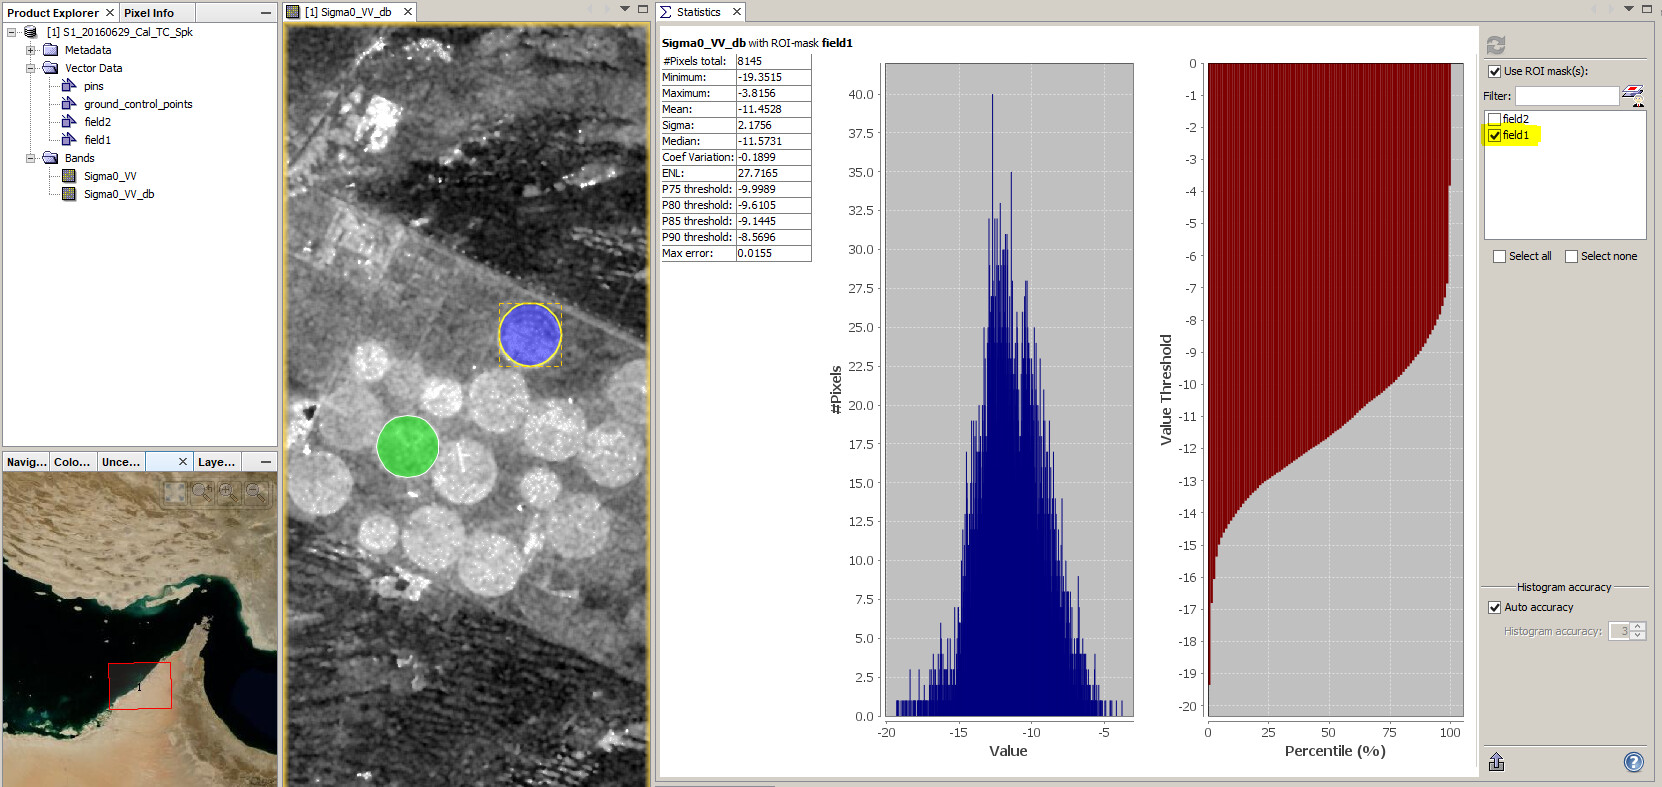
Hi all, I am doing a project whereby I want to examine and identify the max, min., mean, median and standard deviation of spectral signatures in a pre-processed sentinel 1 (s1) SLC product, how would one approach this on SNAP?
2 Likes
Thanks for the reply ABraun, I probably should have included my pre-processing work flow in Graph Builder. What would you recommend (linear to db, speckle filter, apply orbit file, terrain correction) ?
can’t tell without knowing your aim with the data…
I’m also wondering why you go for SLC instead of GRD products.
My goal is to map non-agricultural areas. I forgot to mention GRD and SLC. I was going to try out both of them with IW and VV VH polarizations.
GRD seems sufficient for this task. Regarding the preprocessing: Radiometric & Geometric Correction Workflow
1 Like
Thanks for you help ABraun, I have the GRD products done. After I do the pre-process workflow with the SLC products what would you recommend to do after that? Or is the product suffice for min, max, etc with just the SLC preprocessing.
Sorry, I don’t understand. Why would you use SLC data if the GRD products were already processed?
I just want to do it to see if there are differences in the backscatter signatures, so I can examine the SLC statistics with the GRD one.
then I would rather make a stack of both and calculate a difference image
1 Like
Ok yeah that makes sense stacking them together. Thanks Abraun.