I’m working on flood extraction using S1-GRD Products.
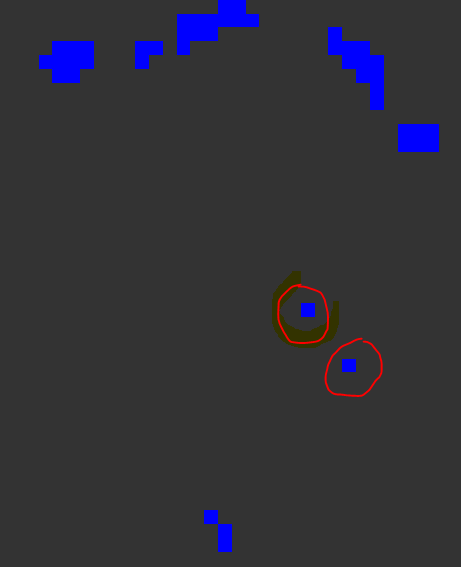
I have an issue regarding the binary flood output obtained using the band math operator. The result is enough good, but it contains many isolated single pixels which are not relevant for my goals (see the snapshot below).
I tried unsuccessfully to exclude them using the available filters.
Maybe (maybe not!), it would make sense to try to solve my issue using the band math, but I don’t have idea how to say, in the band math language, “set as 0 the isolated pixel” or “keep as 1 only the clusters bigger than one (or even 2-3) pixel”.
Do you have any ideas about the expression to use with the band math operator? Do you know any other operation [available in SNAP] to achieve my target?
Wouldn’t a 3x3 mimimum or erosion filter do the job?
On the other hand, they will probably remove more than just 1-pixel-clusters - in case you can tolerate that for your analysis.
Dear thijs.oosterhuis ,
I really appreciate your help, thank you very much!
But I need to find a solution within SNAP (I’m using the GraphBuilder and I’d like to obtain a satisfying result without the need to improve my output using other software/system).
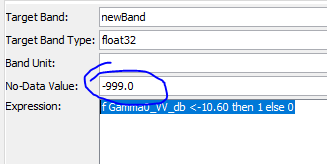
As you suggested I have defined NoData values (I didn’t before) on the BandMath Tab:
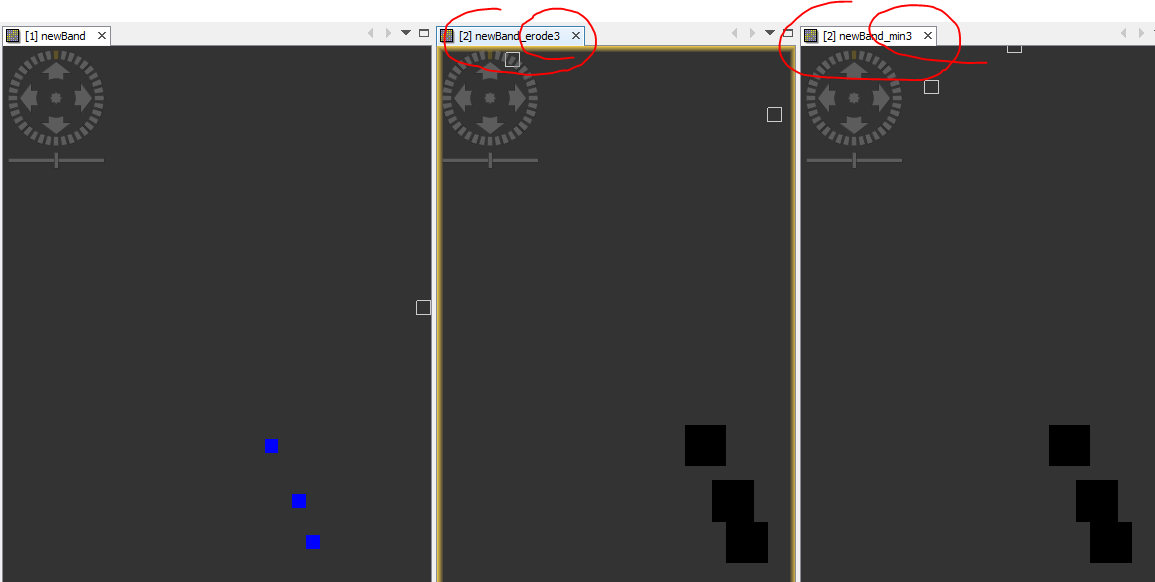
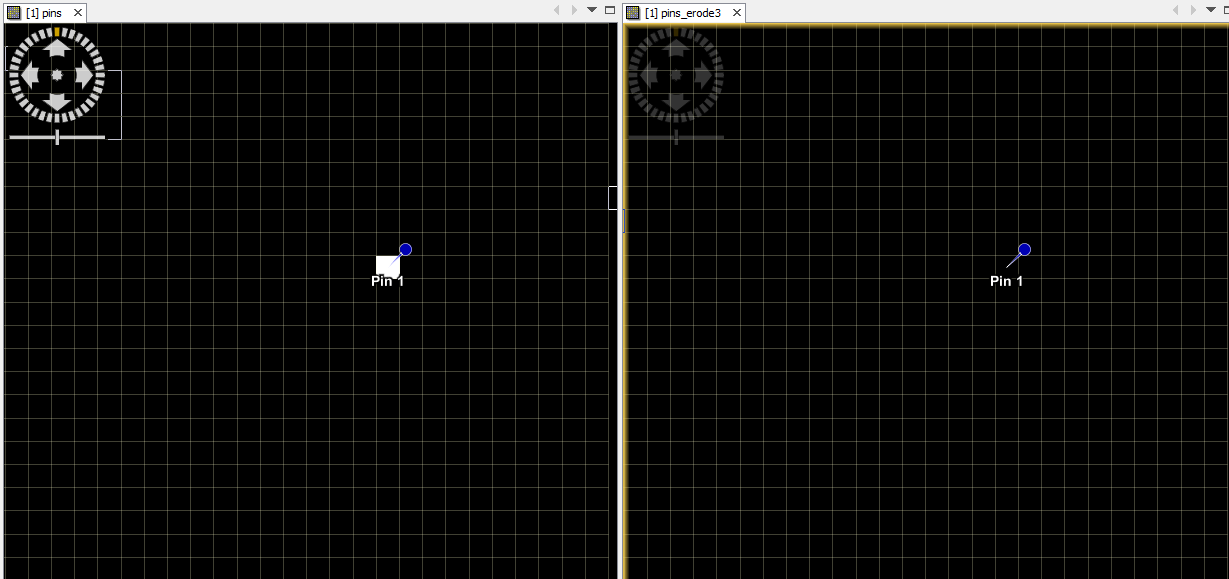
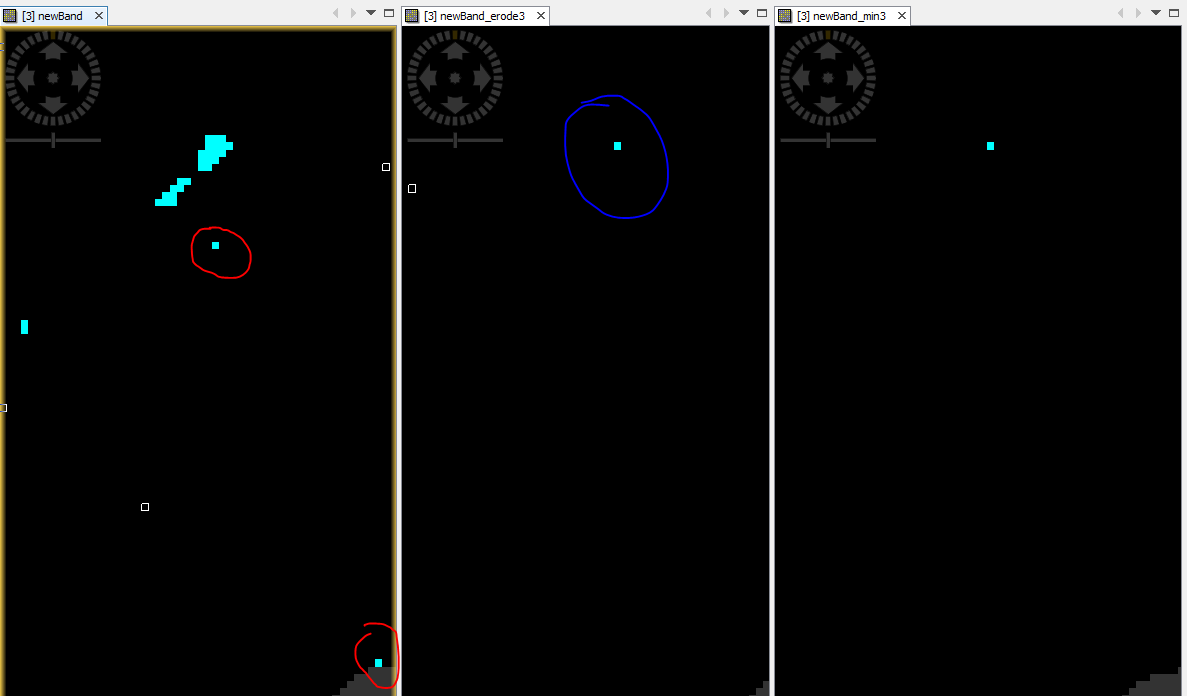
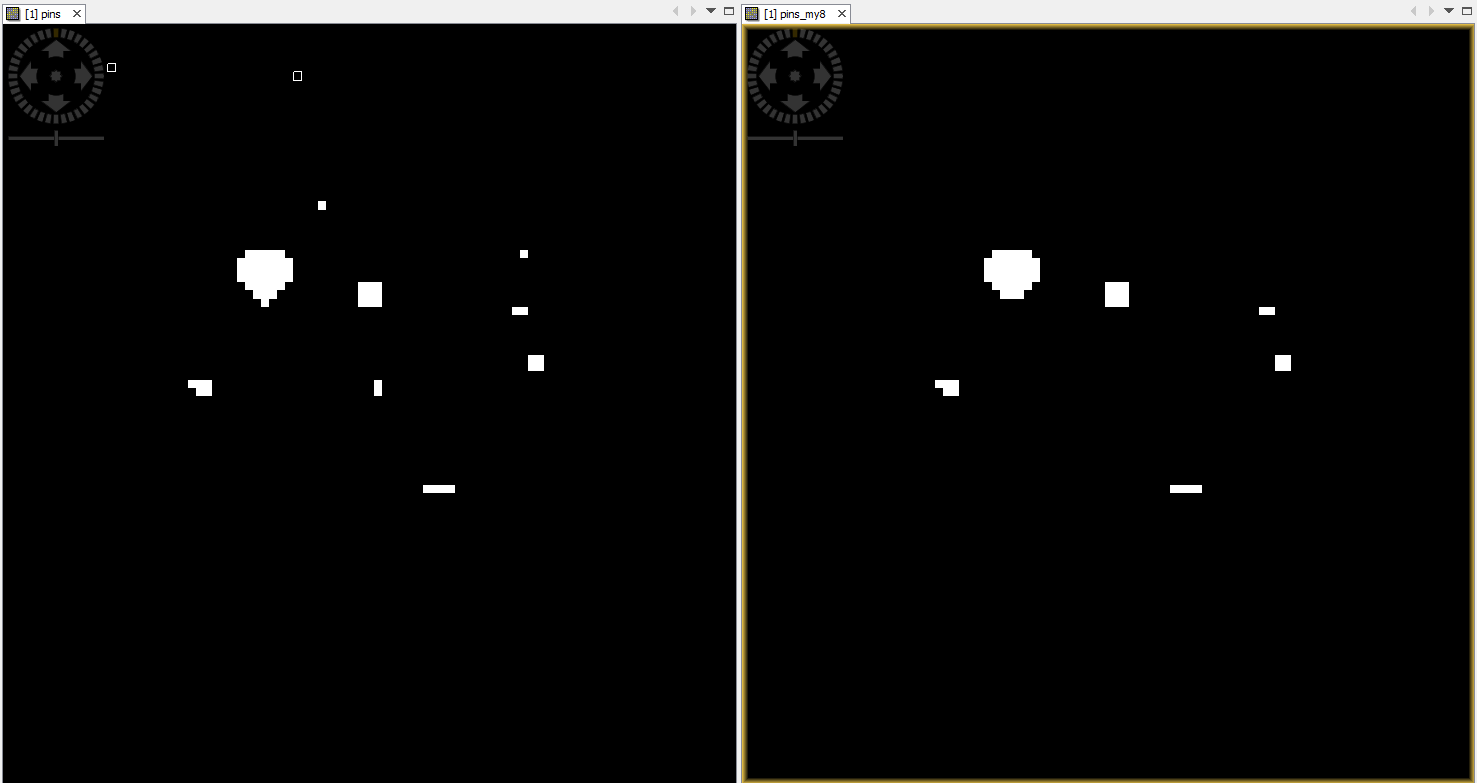
The behaviour of the Filters algorithms now looks more normal, but the application of Erode3 or Min3 doesn’t solve my problem. Indeed, as you can see by the snapshot below [that shows synchronised output]
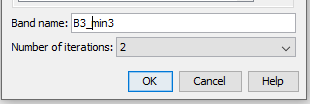
yes, the cyan pixels were now reduced to one pixel left after the minimum filter. You could apply the min3 filter twice, for example, by increasing the number of iterations.
But this does not grant you either, that a single pixel will be left at another location.
Dear Mr @ABraun,
I have performed further tests, and i can say that Erosion and Minimum filters are not the appropriate filters to use in order to achieve my goal, that is to eliminate the single isolated pixel extracted (to respect a concept of Minimum Mapping Units … I can’t pretend to extract flood information from a single-pixel!).
Minimum and Erosion filters have the effect to delete randomly information (also the good one).
In any case, your suggestion to set No-Data Value has been fundamental to guarantee the correct run of filter algorithms.
Many many thanks!
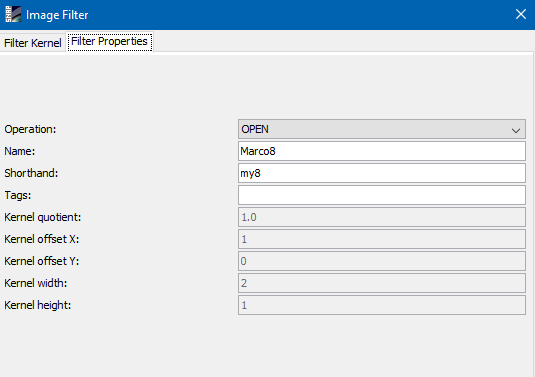
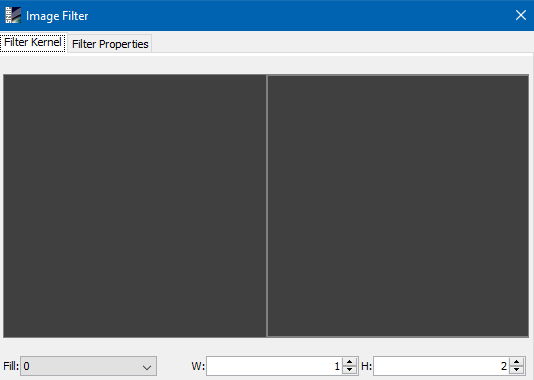
Anyway, i did some research on the forum on the possibility to use the morphological filters with the GraphBuilder + command line and unfortunately, as you said in 2018 [Where is Image Filter option in Raster menu?] it is not possible.
In any case, I’m going to perform some tests about it and I’ll back with some comments!
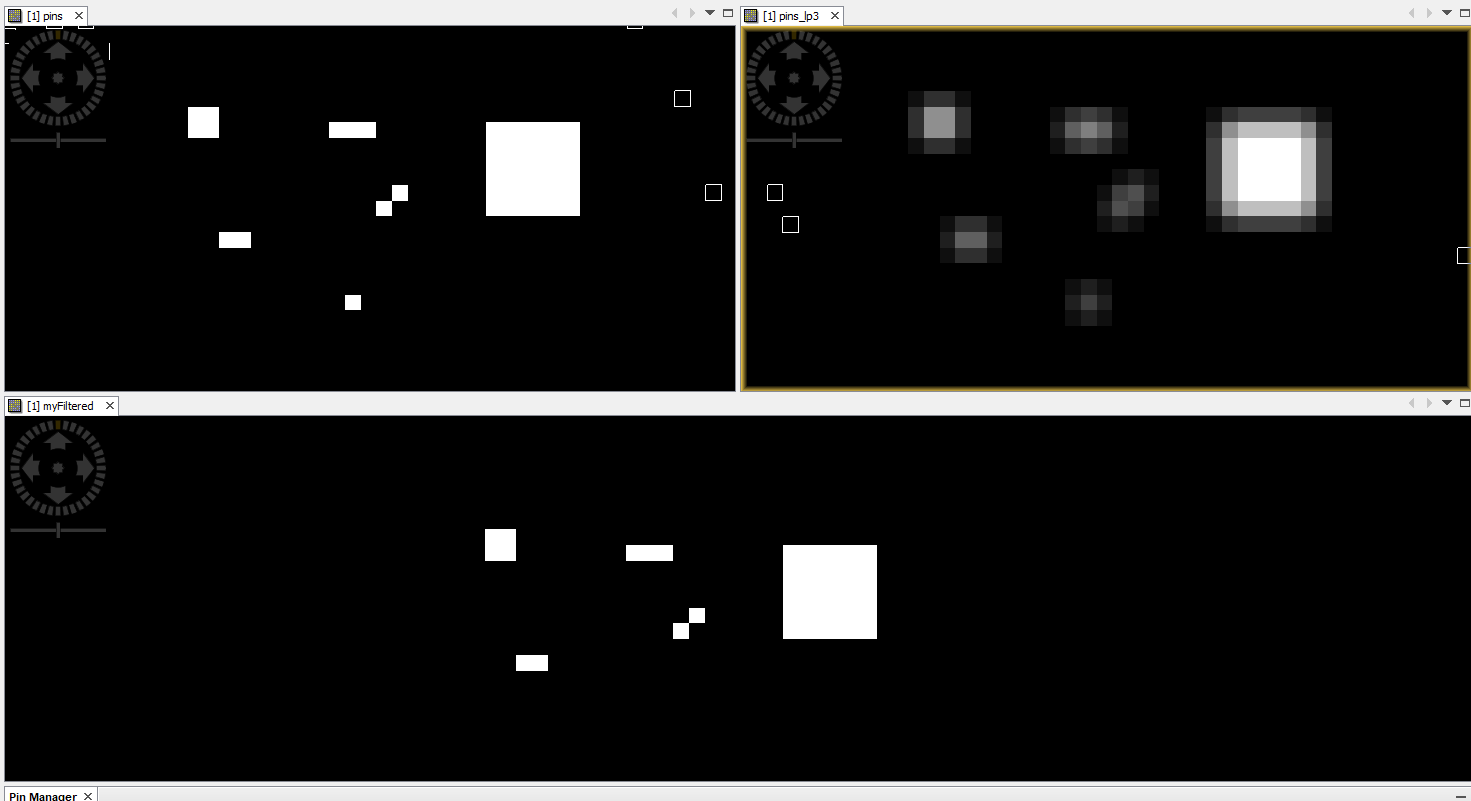
You can first run a low-pass 3x3 filter and afterwards you use the bands to filter out the low values.
In the image on the left white is 255 and black is zero.
In the right image after low-pass the values vary between 0 and 255 lowest non-zero is ~15.
The single pixel has a value of 63.75. So in a second step i can ouse a band maths expression to set all values below 64 to zero and all other to one.
pins_lp3 < 64 ? 0 : 1
By doing this I get the result at the bottom. And only the single pixel is removed.
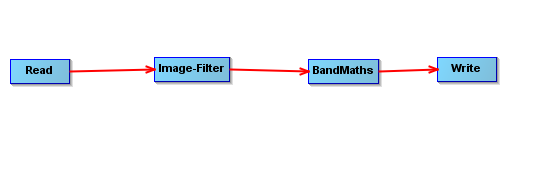
So your graph could look like this.
What you need to know is that the output name of the band which is filtered is the same as the input.
So, you have to use this name in the expression.
I ran some tests (on just one of my case studies).
The results are very good! After the application of LP3, I searched for the best threshold value to use. In my case, the single isolated pixels have the value of 0.25000, but using that value the output was not good enough and I choose 0.5000. To be honest I don’t get how is possible that, systematically, all the isolated pixel have the same value! I’ll study how exactly LP filter works.
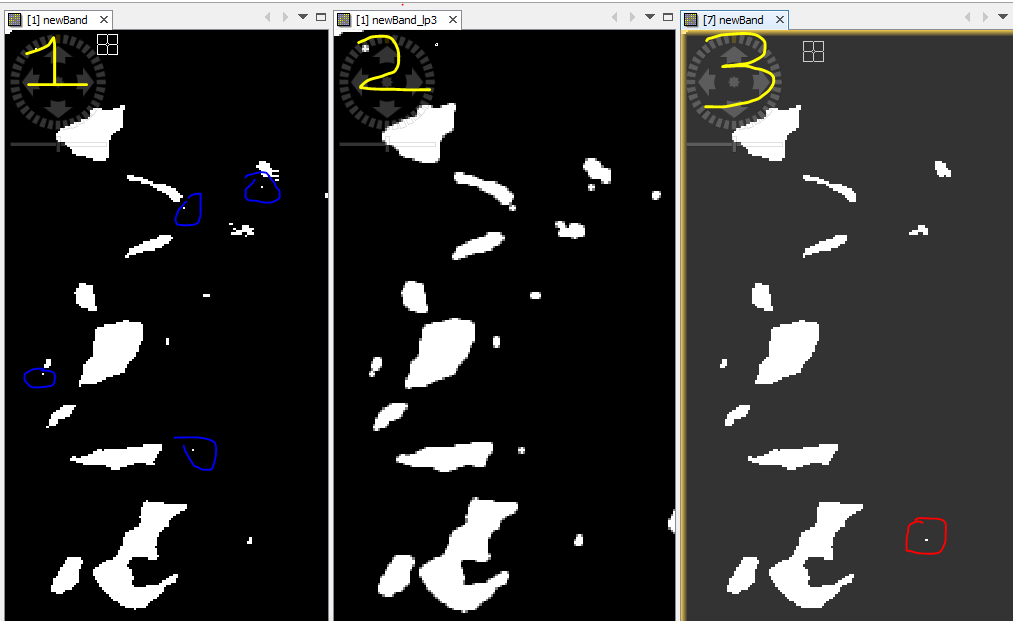
The snapshot below take into account a significant sample of my AOI. Are shown 3 different processing moment:
1 = the binary input before filtering;
2 = the output after the application of Low Pass Filter 3;
3= the final output after the application of BandMath;