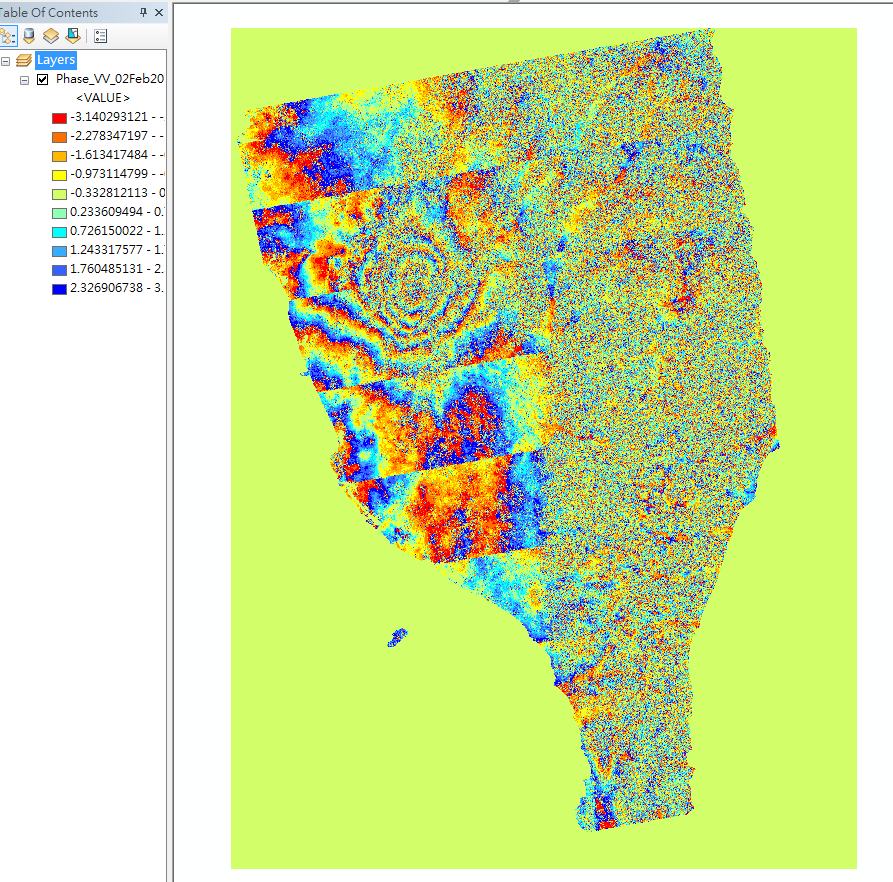
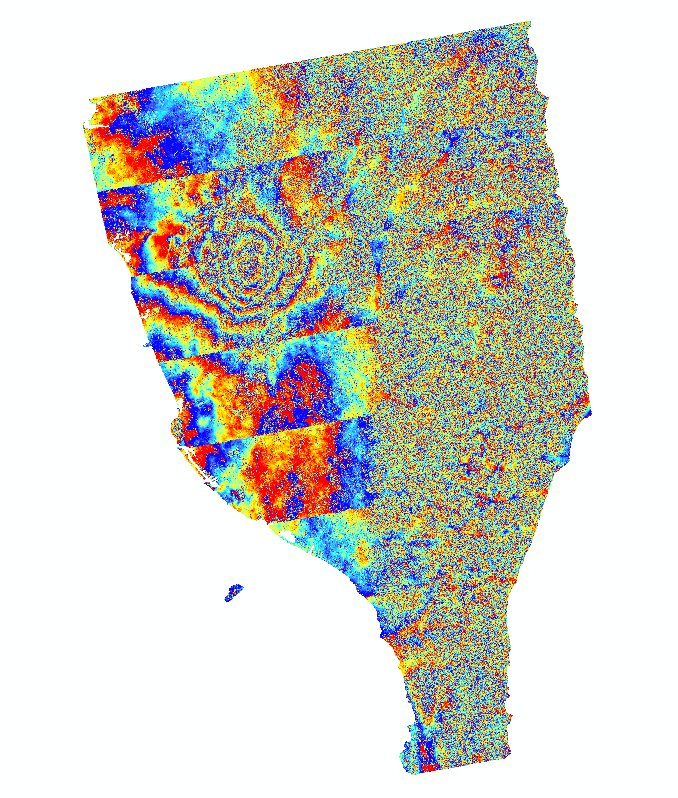
I want to open the img files in the data folder directly into ArcMAP, but it seems strange (the right one).
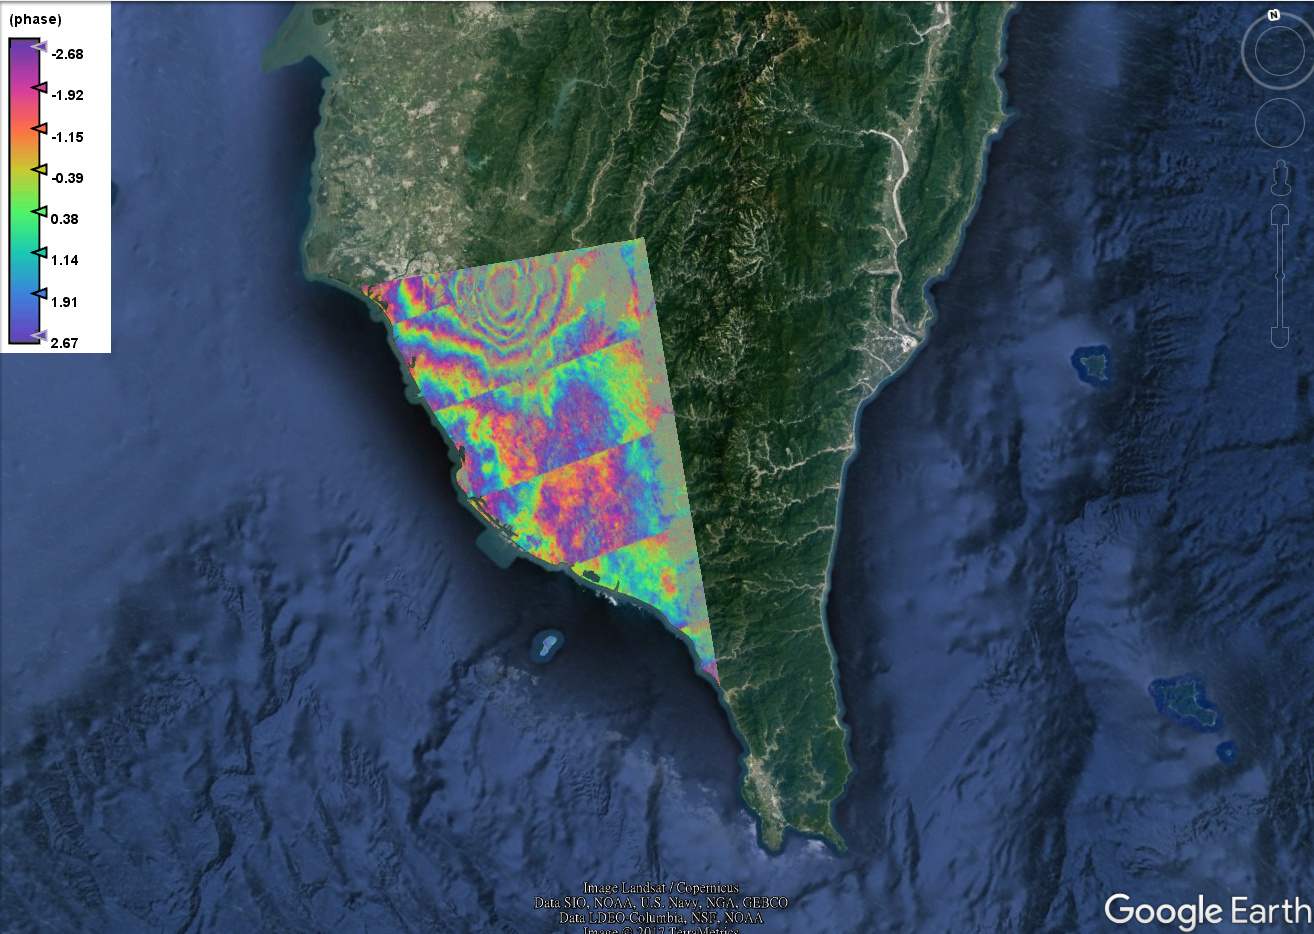
I have applied “Range Doppler Terrain Correction” after DInSAR and filtering step, projected to WGS84 with lat. and lon…
as indicated in the legend, ArcMap didn’t read the minimum and maximum values of your raster correctly. Therefore it is displayed grey. Change the style accordingly so the data is scaled between -3.14 and +3.14.
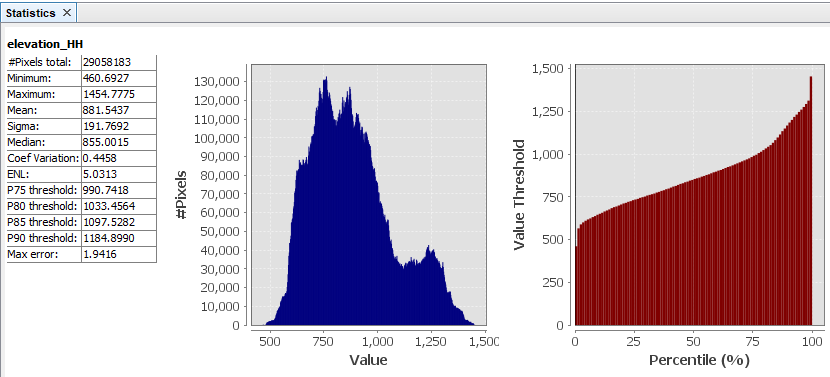
Both programs have different strategies of stretching the colours over the value ranges. Go sure in the band statistics to see if the absolute min/max values really changed. Many programs cut off the outer 2% of all values in order to exclude outliers from the color scale.
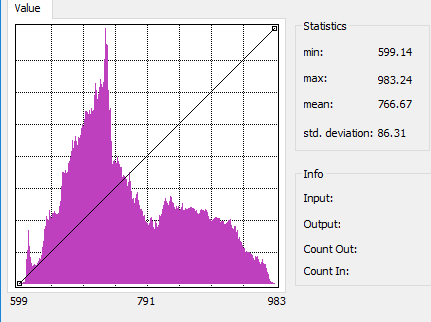
And yes the values I mentioned {The Max - Min values change from 1400mm-450m to 990m - 550m (in arc map).} is what I am saying from the histogram. DO you have any idea on why raster gets distorted like such? Or do you see any error in format in case if I use BEAM-DIMAP and so use other as geotiff?
I wouldn’t suggest exporting as a GeoTiff because it loses metadata and apparently also changes the values. Did you try to directly open the img file in ArcMap? Works best for me actually. It is located in the data folder of your BEAM DIMAP product.
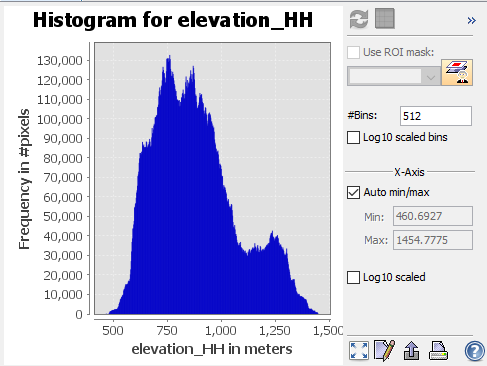
Oh No. What the histogram displays is as below but the pixel values are good as they are originally. However in histogram the values are shown different (599m - 983m) from original in snap (460m - 1454m)
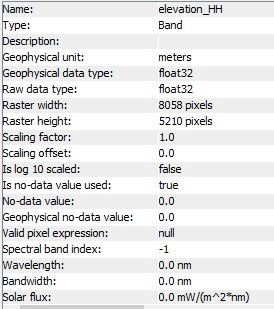
Does the elevation_HH band have a scaling factor or scaling offset? This could explain the difference. The values written to the GeoTiff are raw unscaled values.
Select the band and open from the menu Analysis / Information. There the scaling factor and the scaling offset are shown.