I created a color ramp with color manipulation of a single 8-bit image (1-256) histogram. How do I export the image as a geotiff with the color ramp attached?
I have tried exporting the view as a geotiff and tried band select but neither worked.
I created a color ramp with color manipulation of a single 8-bit image (1-256) histogram. How do I export the image as a geotiff with the color ramp attached?
I have tried exporting the view as a geotiff and tried band select but neither worked.
where do you want to use the GeoTiff where the palette is needed?
Hi and thanks
the geotiff output map is a final product, and, we will be importing the geotiff into QGIS as a basemap for resource managers use. we used 2 sliders at the min and max in color manipulation to create the color ramp.
we have created a standard map product based on Sentinel-2 and field calibration data. the mapping is to be operational so the color renditions must have comparable representations.
Hi
With regard exporting geotifs with color palette. We tried again this morning and it works!! The color ramp is attached to the geotif. Sorry to take your time, don’t know what the glitch was last night:(
Another question. When we open the geotif in QGIS it is a 3 band color image. Can we export the geotif in SNAP as a single band composite color image. the colors burned onto the image as a single band.
thanks
Using geotiff loses much of the metadata available in SNAP, and, as you have seen, you don’t get much control over the contents. QGIS can import NetCDF4-CF data which is a much more complete metadata standard, so you may be better off if you construct the colour ramp in QGIS.
you can also create a qml which contains the color coding for the TIF. When it has the same name as the exported raster, QGIS will automatically assing the color scale (e.g. as single band).
Besides that, QGIS only uses three color representation if the TIF is a stack of at least two images. What exactly is exported from SNAP?
If you export from a SNAP data viewing window (e.g., where you have chosen the color palette) you get geotiff with 4 bands
$ gdalinfo A2006167181000_chlor_a.tif
Driver: GTiff/GeoTIFF
Files: A2006167181000_chlor_a.tif
Size is 768, 768
Coordinate System is:
GEOGCS["WGS 84",
    DATUM["WGS_1984",
        SPHEROID["WGS 84",6378137,298.257223563,
        AUTHORITY["EPSG","7030"]],
        AUTHORITY["EPSG","6326"]],
    PRIMEM["Greenwich",0],
    UNIT["degree",0.0174532925199433],
    AUTHORITY["EPSG","4326"]]
Origin = (-78.000002546447192,45.999998728019783)
Pixel Size = (0.020833339964706,-0.020833332504412)
Metadata:
  AREA_OR_POINT=Area
  TIFFTAG_RESOLUTIONUNIT=1 (unitless)
  TIFFTAG_XRESOLUTION=1
  TIFFTAG_YRESOLUTION=1
Image Structure Metadata:
  INTERLEAVE=PIXEL
Corner Coordinates:
Upper Left  ( -78.0000025,  45.9999987) ( 78d 0' 0.01"W, 46d 0' 0.00"N)
Lower Left  ( -78.0000025,  29.9999994) ( 78d 0' 0.01"W, 30d 0' 0.00"N)
Upper Right ( -61.9999975,  45.9999987) ( 61d59'59.99"W, 46d 0' 0.00"N)
Lower Right ( -61.9999975,  29.9999994) ( 61d59'59.99"W, 30d 0' 0.00"N)
Center      ( -70.0000000,  37.9999990) ( 70d 0' 0.00"W, 38d 0' 0.00"N)
Band 1 Block=768x1 Type=Byte, ColorInterp=Red
  Mask Flags: PER_DATASET ALPHA
Band 2 Block=768x1 Type=Byte, ColorInterp=Green
  Mask Flags: PER_DATASET ALPHA
Band 3 Block=768x1 Type=Byte, ColorInterp=Blue
  Mask Flags: PER_DATASET ALPHA
Band 4 Block=768x1 Type=Byte, ColorInterp=Alpha
I generally use gpt to write geotiff images. These have a single floating point data band.
Thank you all for your suggestions. I was able to export the data from SNAP as a single band image.
The map from SNAP was exported in NetCDF4-CF and the output was an *.nc file. This *.nc file did not open in QGIS. When the *.nc product was saved in SNAP, the *.data folder contained a *.img file that could be correctly opened in QGIS as a single band b/w image. A pseudo color ramp was created for the b/w image in QGIS and saved as *.qml and *.txt files. The color ramp applied to the b/w image created a single band pseudo color image. The single band pc image retained the original data values calculated in SNAP.
Again, thanks
A special format is needed to import data from NetCDF files that have more than one band. QGIS uses the GDAL library, so the easiest way to import NetCDF data is to first run “gdalinfo” in a terminal to find the name of the subdataset. For example, the
NetCDF file I used to create the RGB GeoTiif in my earlier reply gives:
$ gdalinfo A2006167181000.smi_chlor_a_mn.nc
[...]
Subdatasets:
  SUBDATASET_1_NAME=NETCDF:"A2006167181000.smi_chlor_a_mn.nc":chlor_a
  SUBDATASET_1_DESC=[768x768] mass_concentration_chlorophyll_concentration_in_sea_water (32-bit floating-point)
  SUBDATASET_2_NAME=NETCDF:"A2006167181000.smi_chlor_a_mn.nc":palette
  SUBDATASET_2_DESC=[3x256] palette (8-bit unsigned integer)
[...]
To load the chlorophyll band in QGIS, enter NETCDF:"A2006167181000.smi_chlor_a_mn.nc":chlor_a.
How this *.data will be generated?
How to download colour pallet in jpg format?
I think amina mistakenly said
You need to save you data as BEAM-DIMAP. Then you get a *.dim file and *.data directory. The data directory contains *.img and *.hdr files usable with ENVI or other software
What do you mean by “colour pallet in jpg format”?
SNAP offers several colour pallets and you can create your own. Those can be used to create images. Those images can be stored as jpg, png or tiff.
I mean, I want to export that colour pallet used in the graph in jpeg format. Can you please tell me how to export it?
You can use pconvert to create images it is located in the bin folder of the SNAP installation directory. There you can specify the profile. You can find a description in the help.
But you can also create images in the Desktop app. Right-click in the image view and select Export View as Image or Export Colour Legend as Image.
The second one gives you and image like this
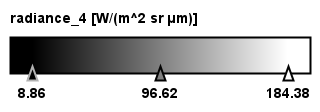
Maybe this is what you are looking for
yes, thanks for your kind help @marpet. Can you tell me that if I have used 8-9 bursts to generate the displacement map can I extract small region out of it?
I’m not a SAR expert. You better ask this in the S1TBX section.
Search first for already existing threads. It could be that this has been asked and answered already.
There are also several tutorials available. They might answer your question too.
Tutorials – STEP (esa.int)