I’m setting up a project where I’m using S2 images of Greenland from 2017 and 2018. This is all nice and dandy, however I realized that there is less snow on the images from 2016. So I went and downloaded it through my python script. Now to my shock and horror, these images are not quite processed the same way as the images from 2017/18. They are missing the one file I need, where RGB channels are stacked up, neatly saved in a .jp2 file.
So I thought I’d do it manually. First I tried with gdal scripts. It worked all right up untill I had to load it in rasterio module. Seems that gdal stacks the vectors up in a wrong way regardless of how I defined it. So I abandoned that.
Then I set on to learn how to use SNAP and do it there. So I installed SNAP, loaded up the image I’m interested in and subsetted it twice to narrow it down to channel 4,3,2. So far so good.
Now when I want to export that to .jp2 format - something weird happens. It saves the file allright, but the image cannot be read. No GIS program, gdalinfo or even SNAP itself. When I try and run the info on the file, I get this.
ERROR 1: No code-stream in JP2 file
gdalinfo failed - unable to open ‘subset_1_of_WWU_resampled.jp2’
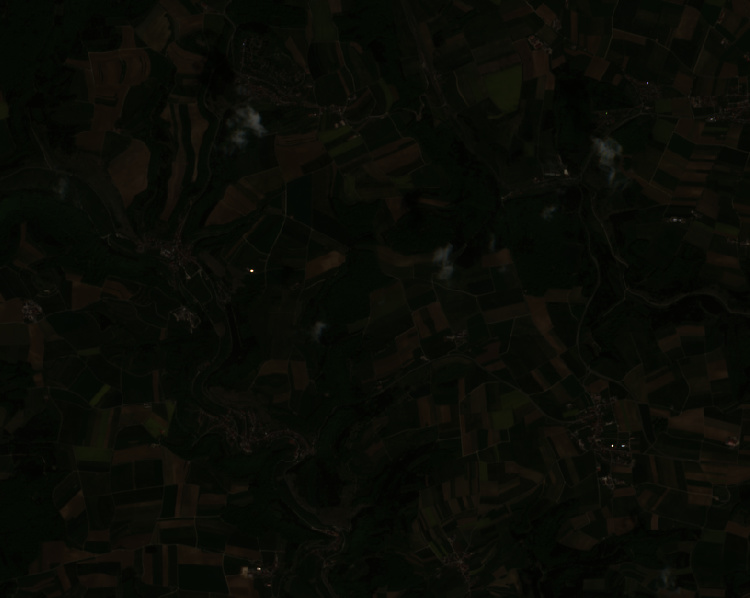
It works for geotiff, but the image is incredibly dark compared to the really pretty view when I call the RGB window.
So in short:
Why can’t i export working jp2 files
Why are the images so dark and colorless compared to when they are in the RGB viewer.
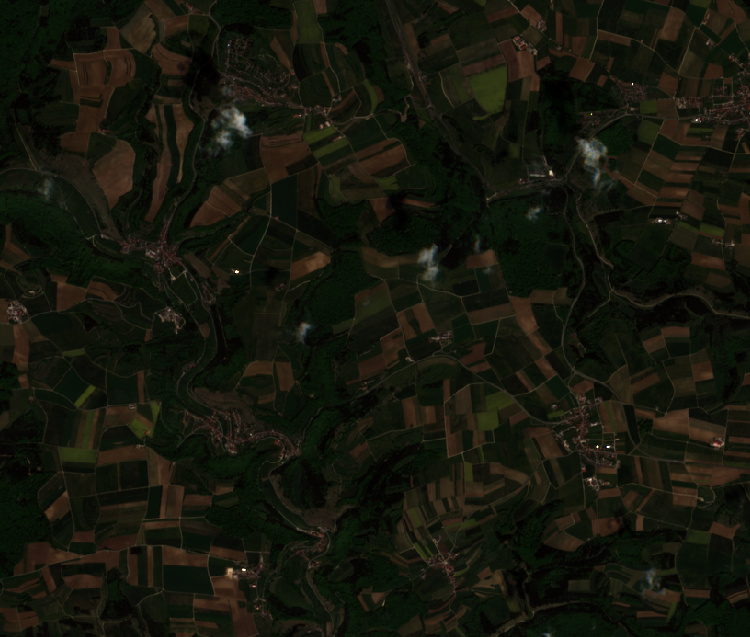
Essentially I just want I see in the RGB window, complete with all projection information stored so I can feed it into my python pipeline.
Where did you download the S2 images?
It also makes a difference if you open them by the import function selecting the “MTD_MSIL2A.xml” file or if you directly open the jp2 files in the GRANULE folder.
The data’s actual value range might be considerably larger, especially when there are extremely white clouds in the image, but these values are neglected by SNAP so that the data has balanced contrasts.
Have a look a the color manipulation tab to see how the data would look without contrast enhancement. You must apply the stretch to all three bands of the RGB.
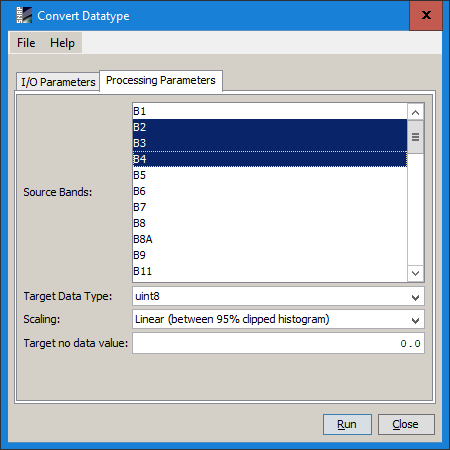
If you need already stretched data, you can use Raster > Conversion > Convert Data type
There you can select JP2000 as an output format and apply a scaling, e.g. 95% clipped histogram
How writing stretched JP2 should work (didn’t fully test it, EDIT: @kraftek 's solution seems fine!)
Import the full S2 product.
Optic > Geometric > S2 Resampling Processor
Uncheck “save as” so it is not physically written but just creates an intermediate product (see comments here), jmake sure you have 10m, press OK, Intermediate dataset 1 is created.
Open the output, zoom to desired create a subset (either with Raster > Subset or right-click > “Spatial Subset From View”) select required bands in the Band Subset and click OK. Intermediate dataset 2 is created. Save it.
Open the RGB to see if everything is alright.
Export as JP2000. To handle the contrast stretching, use this instead: Raster > Conversion > Convert Data type. Use intermediate dataset 2 as input, select JP2 as output format, select suitable stretching, run.
For the export to jp2:
I have tried the same steps you have mentioned and, first time, I was not able to open the resulted product (jp2) with 3 bands. Being on Windows, I suspected that the path was somehow too long due to the naming of the product. Renaming it to rgb.jp2 solved the isssue and I was able to open it in SNAP.
It is not the location of the product that matters, only the name. That is because SNAP will create its own cache structure, and for this particular product it would be something like C:\Users<username>\.snap\s2tbx\jp2-reader\6.0.2\8639ec00f27ac59d01d9639d322b90a9\subset_0_of_s2a_msil1c_20170310t092021_n0204_r093_t34tgp_20170310t092027_resampled_cached, which is awfully long. But having a small name helps.
For the darkness of the resulting image:
That all depends on the viewer you are using. SNAP performs a dynamic stretching of the colors in order to look “prettier” (not so dark). Other tools may not.
Thank you for your answers!
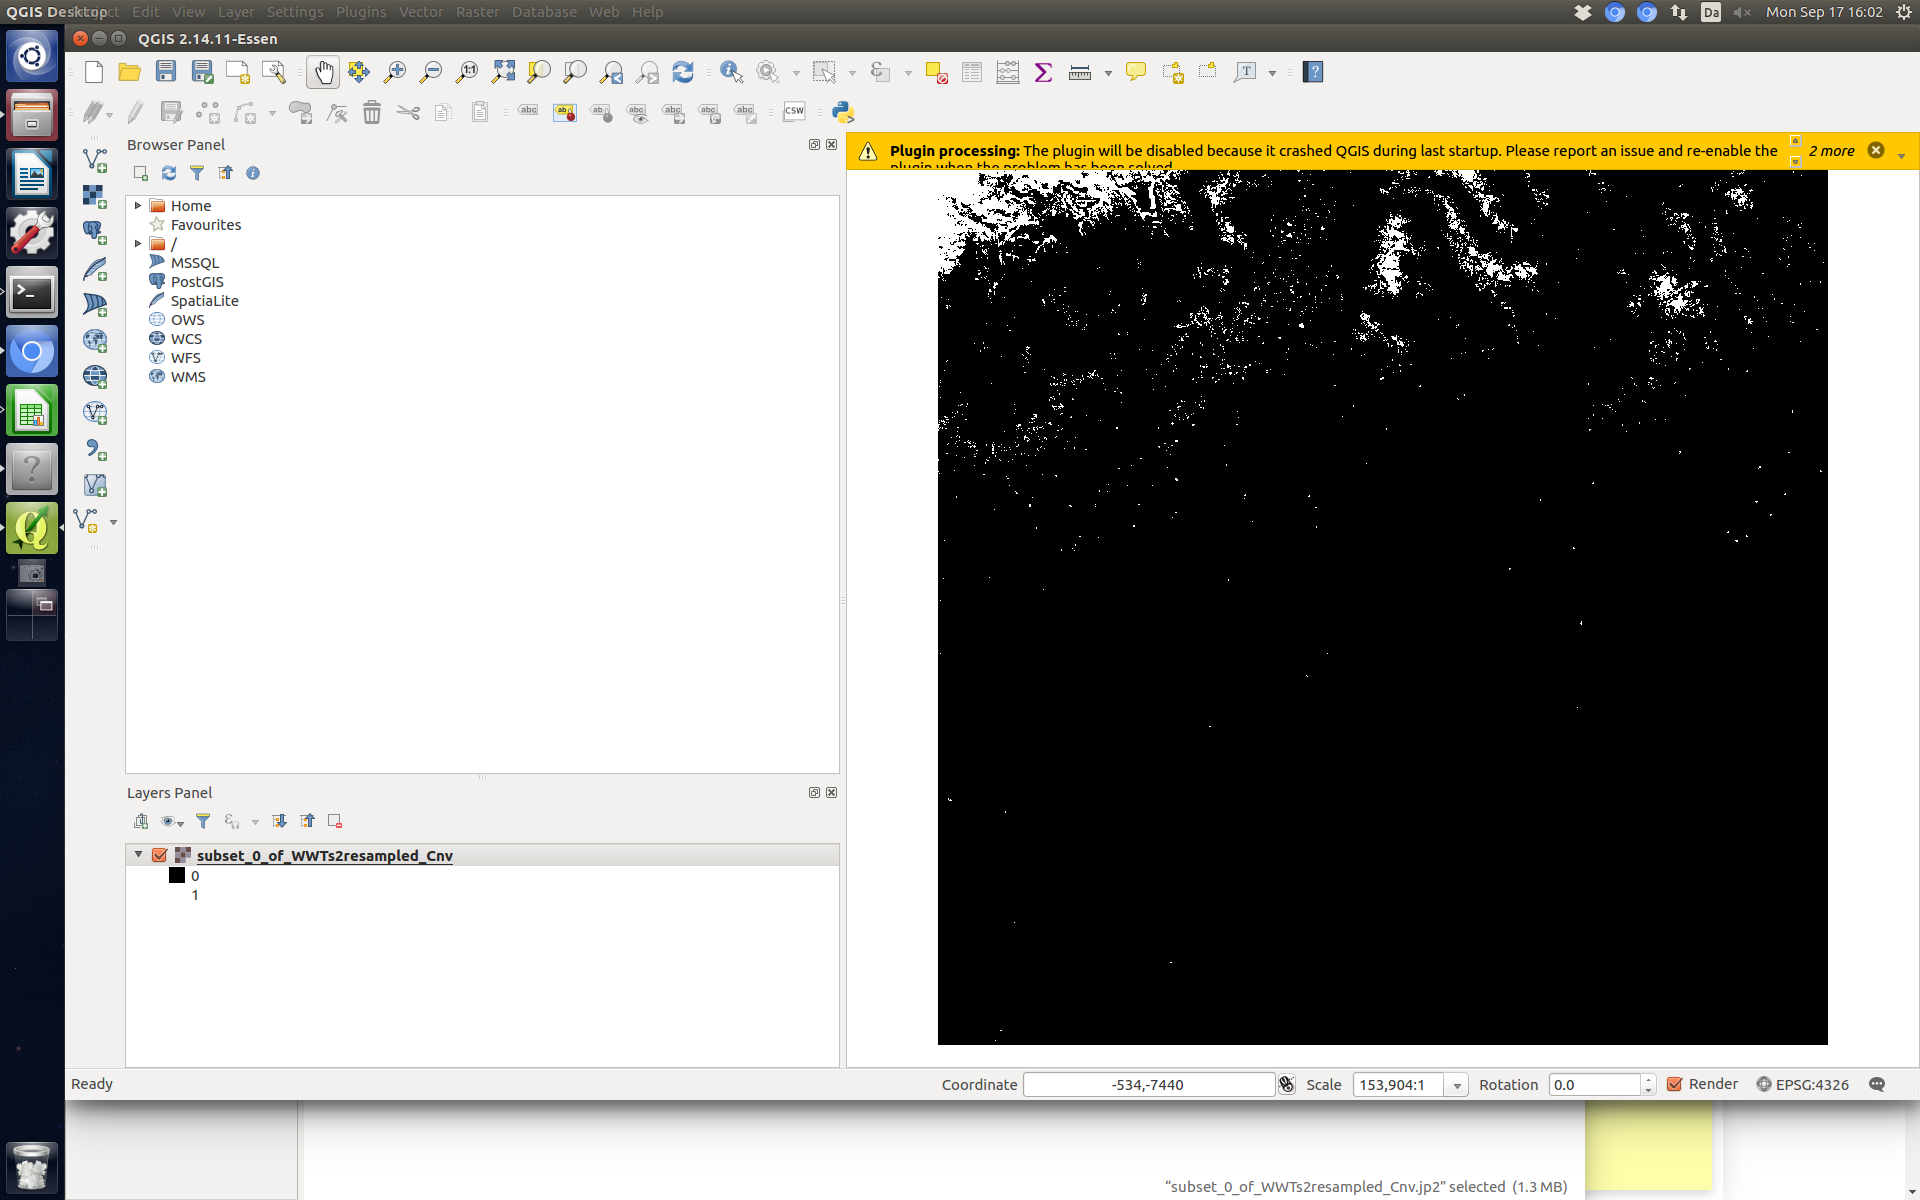
I did import the .xml file as you described and I am now able to export to jp2. However the image that comes out are black and white and completely useless :I
Not sure what I am doing wrong. In the RGB viewer it is absolutely excellent. ( See attached image ).
Following the introduction of the Compact Naming Convention on the 6th of December 2016 (see the Sentinel-2 User Guide Product Naming Convention page for details), a TCI (True Colour Image) in JPEG2000 format is included within the Tile folder of Level-1C products in this format(1). The TCI is an RGB image built from the B02 (Blue), B03 (Green), and B04 (Red) Bands. The reflectances are coded between 1 and 255, 0 being reserved for ‘No Data’. The saturation level of 255 digital counts correspond to a level of 2000 for the individual bands (i.e. reflectance of 0.2).
(1) Products acquired before the 6th of December 2016, and products reprocessed within the PDGS - including those Reprocessed after the 6th of December - still use the old format Naming Convention.
what happens if you re-open the jp2 in snap? I suspect, that your jp2 is from converting reflectances (not the DN) to integers and contains exclusively the values 0, 1, and 2 (and since reflectances in the 3 bands are different, but not by that much, the stored values in each band are identical, hence end up as grey-scale image).
Its black and white as well.
Right now I think the best bet it so figure out how to do this with Gdal rather than SNAP. I simply do not know enough about this problem in order to produce one of those standard TCI images :I
Nothing against SNAP, but for that kind of tasks I’d prefer command line alternatives any day of the week. However, to reproduce the TCIs, you have to apply some mapping of the DN (0-2000) or reflectances (0-0.2) to the 1-255 integer space in any case, whether you use SNAP or gdal or any other tool. In SNAP, I guess, band maths would be a (or the?) way to go.
you mean, you have that “on screen” in SNAP? or in what way do you “have” it (obv not as jp2-TCI ) ?
i’m not that familiar (yet) with SNAP and exporting different formats, but I suspect SNAP (rather being a satellite data analysis and not an image processing tool, though that overlaps occassionally) is not exporting the image “as you see” (or wysiwyg), but tries to export the actual pixel-related values. in your case, I speculate, the reflectances.
I’d try using band math with a linear y=ax+b mapping of x=0 to y=1 and x=0.2* to y=255. that should be straight forward.
additionally mapping values above 0.2 to 255 and values below 0 (particularly the NO_DATA value) to 0. that requires conditional band maths. but had also been explained in the STEP tutorial on band maths. I think.
*or x=2000, in case you have DN. check the actual values in your band using the pixel explorer (i think, that’s what it’s named…) tool.
Finally figured it out. This thread here, answered by RoVo at the bottom. That did the trick just right. Granted the output is not a jp2. But a geotiff work just as well for me
I used the gdal module to merge and translate it. The image looks awesome and my pipeline is now running again