Hello dear Researchers,
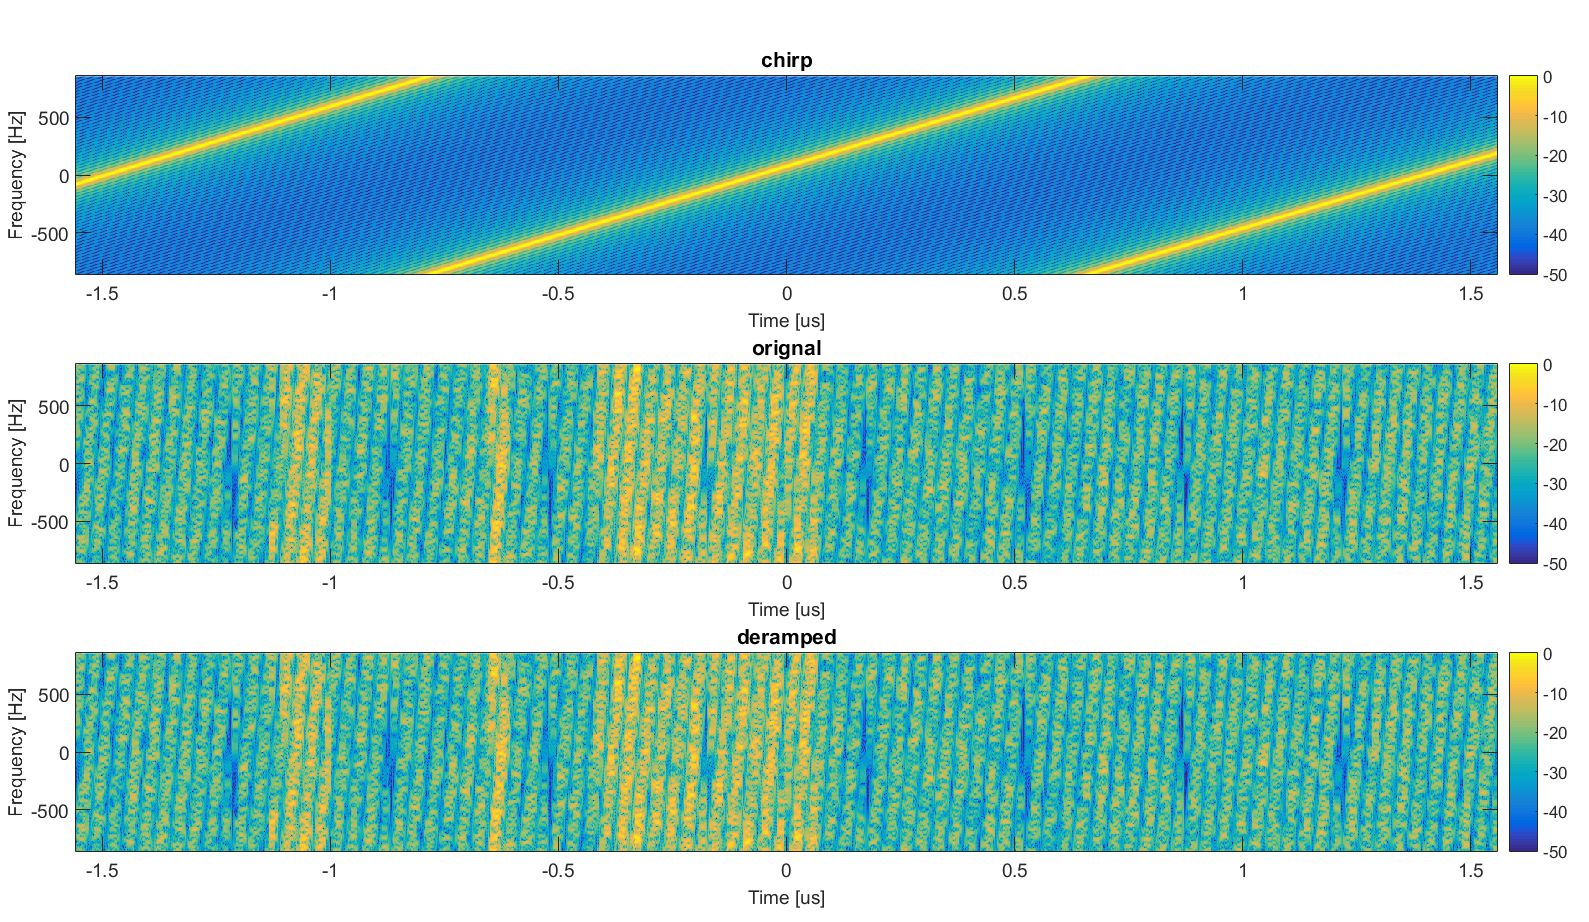
I need guidance related to derampdemod. working with SLC_IW data, after applying derampdemod signal encountered with stripes.
https://sentinels.copernicus.eu/documents/247904/1653442/Sentinel-1-TOPS-SLC_Deramping.pdf/b041f20f-e820-46b7-a3ed-af36b8eb7fa0?t=1533744826000
Anyone who worked with this process is given in the above link, actually I need to produce figure.2. spectrum after derampdemod.
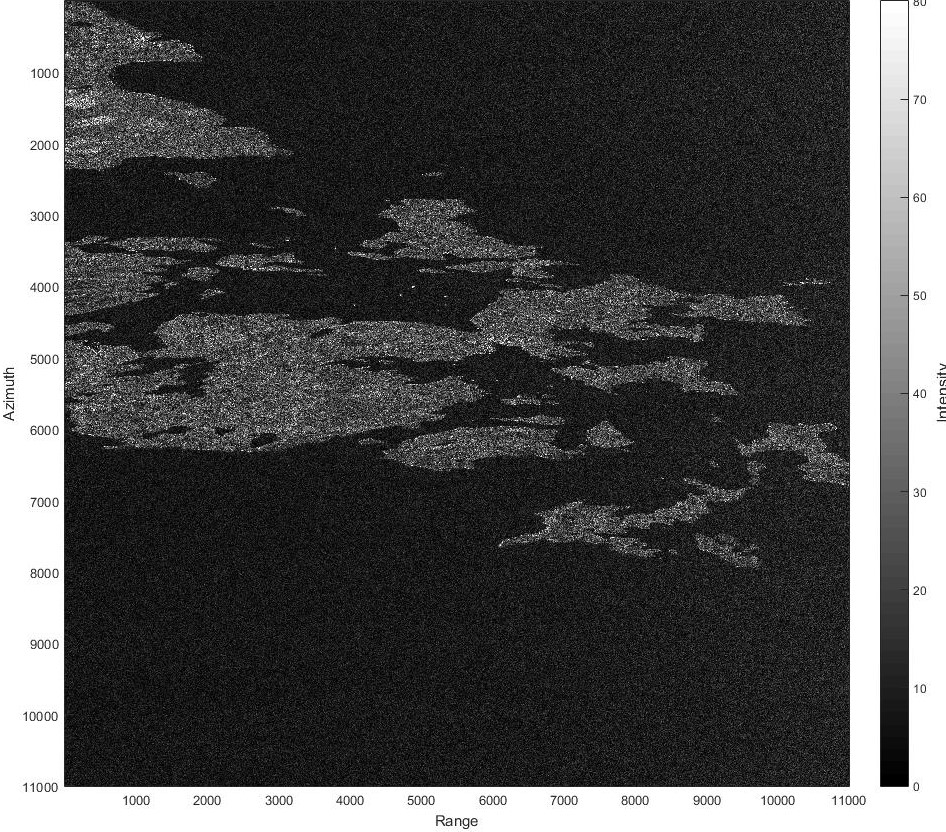
I have attached one intensity image and after derampdemod I encountered stripes.
Looking forward for your advice.

Sentinel-1-TOPS-SLC_Deramping.pdf (609.2 KB)
Dear Researchers,
ESA STEP FORUM[Sentinel-1-TOPS-SLC_Deramping.pdf|attachment]
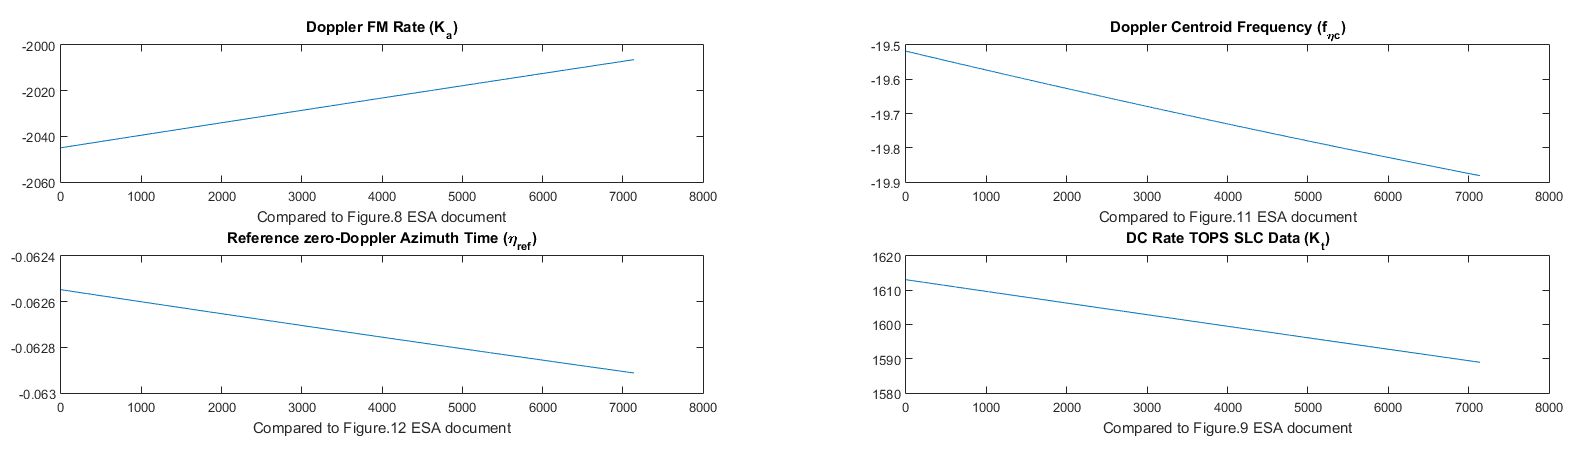
I did follow the ESA document to deramped phase, After careful analysis of parameters, mostly are a dependent function of range sample number.
I have attached a file containing parameters. In a figure subplot of “eta_ref” the values are in range (but values should be in the form of “- to +” as given in ESA document figure.12 ).
𝜂𝑟𝑒𝑓(𝜏) = 𝜂𝑐(𝜏) − 𝜂𝑐(𝑁S_𝑠𝑤𝑎𝑡ℎ/2 )
Can you please guide me what’s the difference between 𝜂𝑐(𝜏) and 𝜂𝑐(𝑁S_𝑠𝑤𝑎𝑡ℎ/2 ).
Looking forward to your advice.