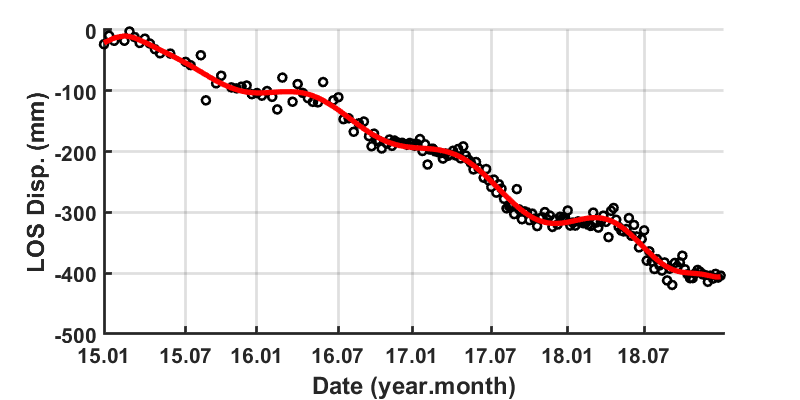
I have a quite interesting question. I processed Sentinel-1 data including 4 years data (2015-2018) with SNAP-StaMPS (PS) software. I investigated time series of a point (figure below) and about 400 mm displacement is observed. Mean velocity (v-do) of that point is about -105 mm/year. Everything is OK until now.
But then I decided to process data annually. For example, I processed only 2015 S-1 data with a new master within 2015. So I have results of each year (2015,15,17,18) processed separately from each other. Then I looked at the same point that I previously explained, I see quite an interesting result that I could not able to find an explanation myself. Mean velocity (v-do) of each year is as follows:
2015–> -116 mm/year
2016–> -156mm/year
2017–> --197mm/year
2018–> -202mm/year
Compared to the mean velocity of the whole data (2015-18) which is -105 mm/year, these annual velocities seem to be so high.
We are investigating that but it seems that subsidence is a result of groundwater overexplotation.
So we can assume there is no effect of earhquake. So subsidence is an ongoing process in 2015-18.
No, number are not the same. 15-- > 23, 16–>36, 17-- > 61, 18 --> 61. Increasing number of data is just because of S1-B addition.
Temporal baseline? Well I have S1-data for every 12 days in 2015 and it becomes 6 days with S1-B addition. Almost all data is processed. No ifgs are eliminated.
Same paramaters at every process.
Times series in STaMPS are calculated withing a circle. So that curve provided in figure contains mean of all points within a circle of 50m.
This could be the first effects of differences, more images in most probably cases more detected time movement and also more points, could appeared, as you see the displacement is increasing in parallel of images increase, But still some investigation should be done, select some number of points of each year and look at the curve behavior this point should be the same positions of each year.
The previous results of four years give the average of 50 radius.
Something else is worth to detect, compare the water pumping period and the dates of your images and also the result of displacement, all of these issues give an indicator of the results.
Well processing each year data individually provides me more PS points, that’s for sure. But my focus here is the same position. Annual results and whole data processing may result in different PS numbers but hence we are looking the mean within 50m radius I think it should not differ so much in general.
For the whole period 2015-2018, I used the total data which is 181. So whether I processed 2018 years data individually or within 2015-2018 period I have the same data frequency, it does not change.
When I investigate the time series of the same point within annual processing they are quite consistent with mean velocity, v-do. So for example in 2018 annual processing I have mean velocity of -202mm/year for that point and in time series of that point I see about 200 mm displacement. But time series of that point for 2015-2018, provided in the figure, shows me about 100 mm displacement. Not even close to 200 mm.
Well we will compare it with groundwater level. But here I just try to understand why annual processing of data gives higher deformation velocity compared to whole data processing.
The number of points are different within the radius 50 , should be increased once the number of image are increasing, and the all images are processed together , the result of displacement is the average of points within radius 50. An important issue related to all image results, most probably scenario the number of points should be increased , but might be the most effective points are not detected, that’s why, I asked you within my previous post, to check up the behaviour of same selected points in each processed package and compare them.