Hi Rajaa,
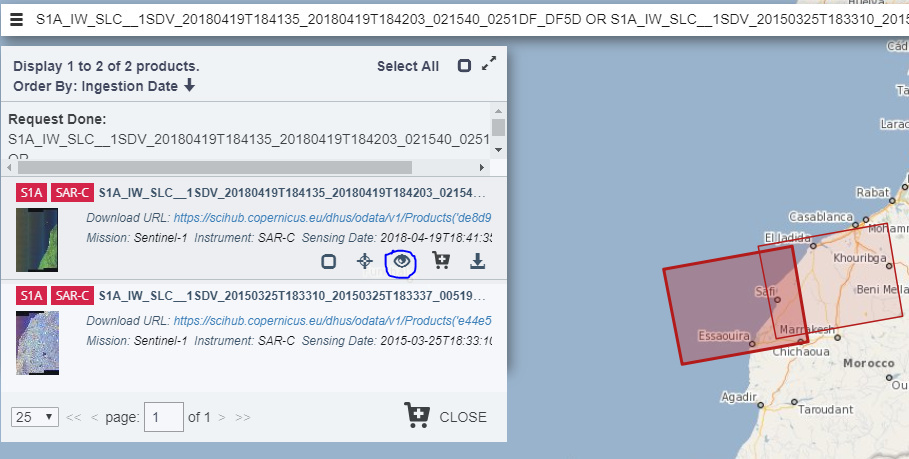
Make sure that your images are taken on the same relative orbit. If you want to generate an accurate interferogram, the images must have a slightly different geometry of acquisition. That is insured when the images are taken on the same relative orbit (and on relatively the same burst time). For example your first image which dates to 03/25/2015 have a relative orbit of 45, But the second image (04/19/2018) have a relative orbit of 118. You can see that your products overlap on just a small region relatively to the whole image.
You can specify the relatif orbit on the search step before you download the products. To define which relative orbit to choose :
1-You have first to determine your region of interest using a rectangle for example while searching the products on “Copernicus Open Access Hub” website.
2-Then you specify the search criteria as (Product type : SLC, Sensor Mode : IW, Polarisation : VV Link ).
3-You click search. Many products will appear on the search result.
4-So you have to choose on product which cover the max of your region of interest.
5-Then you click on view product details (a small eye under the product name).
6-On product tab you will find the relative orbit of your product.
7-Copy it, then return to the research criteria and add it in relative orbit parameter.
8-You can add then specify the sensing date and research again.
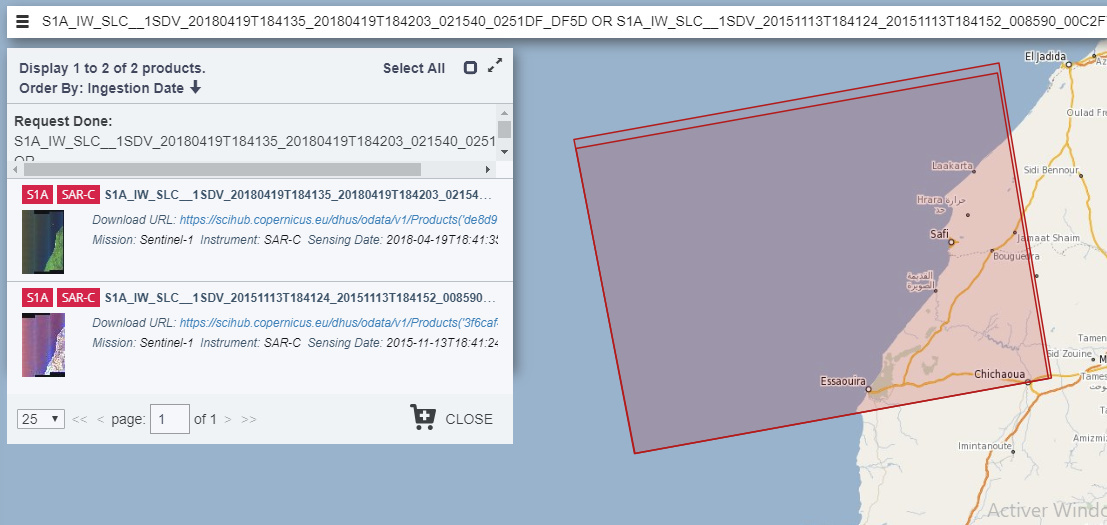
This time you will have only the product which are taken over your region of interest within a specific period of time and on the same relative orbit.
your can two images on :
Orbit 45 : (includes Safi & El Jadida)
S1A_IW_SLC__1SDV_20150325T183310_20150325T183337_005192_0068D1_FBDC-1 (Yours*)
S1B_IW_SLC__1SDV_20180420T183252_20180420T183320_010571_01346F_790B

Orbit 118 : (includes Safi & Essaouira)
S1A_IW_SLC__1SDV_20151113T184124_20151113T184152_008590_00C2F7_5900
S1A_IW_SLC__1SDV_20180419T184135_20180419T184203_021540_0251DF_DF5D (Yours*)
Good luck