what is the perpendicular baseline between these acquisitions?
Actually, I don’t know but I saw the distance between the orbit for both is so close.
Realy, how can I know the perpendicular baseline between images that I want to choose?
and another thing please, how can I know the Image took in night time or daytime?
Thank you for helping me, sir.
Apologies sir, these images are not suitable for interferometry?
it is demonstrated in the video I posted above.
Radar does not make differences regarding day or nighttime. The suitability of images depends on their perpendicular baseline (150-300 m is ideal).
Thank you so much sir really I learned a lot from you. Thank you very much.
1 Like
a small remark: The “set as master” button is no longer present in current versions, I just received the following response from the ASF support:
- Click on a scene in either the left column (Scenes) or on the scatter plot on the right
- Then click on the Scene Detail tab at the top of the left column
- In the Scene Detail window, click on Baseline at the bottom
- This will create a new search with the scene you selected set as the Master
having said that, these pairs might be also worth testing
159 m 24 days
S1A_IW_SLC__1SDV_20151110T145821_20151110T145851_008544_00C1A6_7F51
S1A_IW_SLC__1SDV_20151204T145815_20151204T145845_008894_00CB8B_5555
150m 12 days
S1A_IW_SLC__1SDV_20171205T145824_20171205T145851_019569_0213B4_8B44
S1A_IW_SLC__1SDV_20171123T145824_20171123T145851_019394_020E36_8E1E
148 m 12 days
S1A_IW_SLC__1SDV_20150713T145845_20150713T145912_006794_009227_EE79
S1A_IW_SLC__1SDV_20150725T145846_20150725T145913_006969_009723_516F
Yes, sir, I noted that, Thank you I will follow these tips.
Thank you very much for your interest, you helped me a lot.
I would like to inform you that I finished the creation of the DEM successfully. Thank you so much.
1 Like
happy to hear that. Are you satisfied with the results? Which pair did you use in the end?
Yes sir, I am satisfied Alhamdullah. About the pairs that I used ar these have the acquisition date of 2019, actually, I liked to try by choosing the pairs by myself. It looks successful.
Realy your advice helps me a lot. thank you so much.
Still one thing else please, Ho I can apply that on QGIS to create a shape that will appear this DEM that I created.
Actually, I finished until representing the DEM by Google earth, but my lecturer want with QGIS 
I have responded in the other topic you created. Maybe you can post screenshots as examples to illustrate your problem.
Apologies sir I saw it now, firstly I will try with your tutorial after that if I have problems I will inform you. thank you very much.
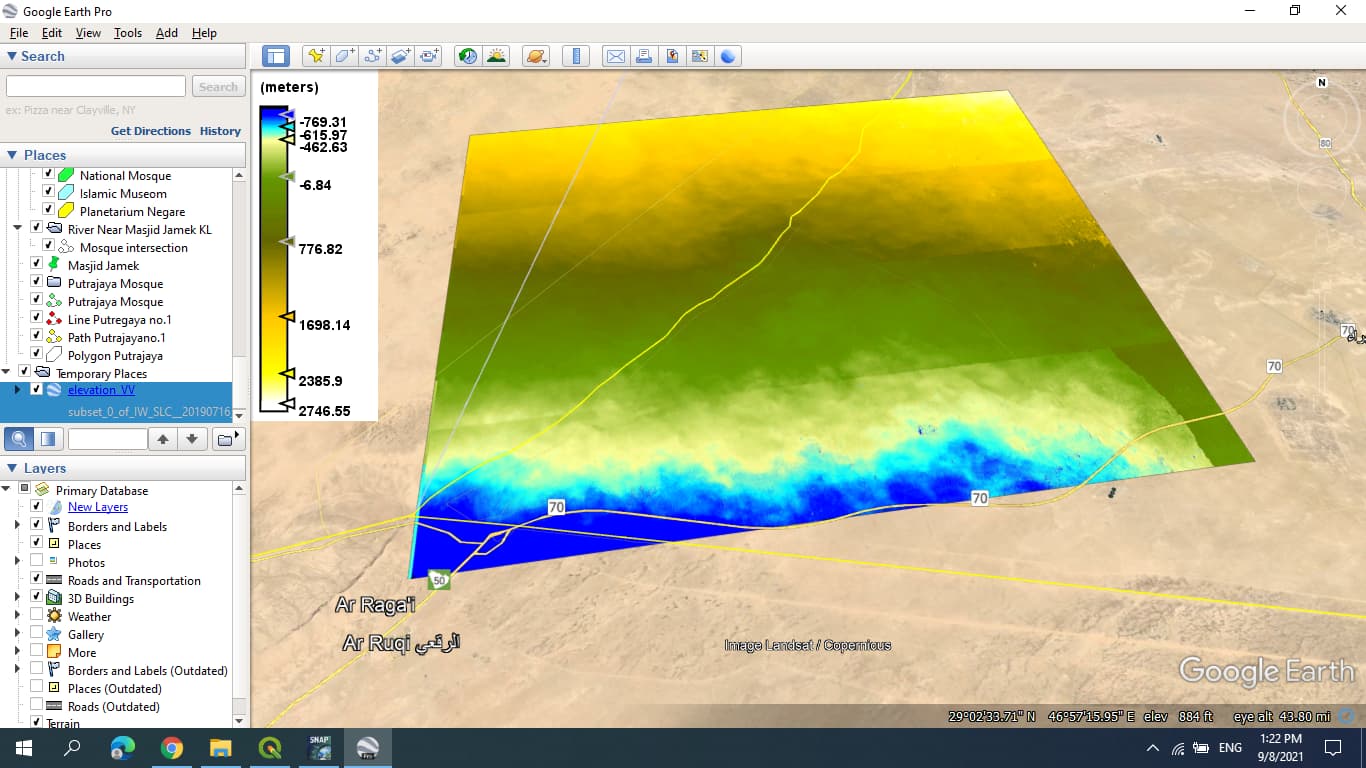
Apologies sir, this image is the final result when I represented it on Google earth.
Because the area of interest is a flat area (desert) it looks not effective like the mountain area.
Is any way to make this representation more effective or nicer than this shape?
You can create a hillshade visualization in QGIS to highlight the variation, also use different a color coding or use classified colors.