Summary
GPT and SNAP graph processing differs.
Note
The problem I’m about to report was tested in two 64-bit Linux machines (personal and server), with both SNAP 7.0 and 8.0 versions. No divergence was found in these tests.
Problem description
I’ve created this simple graph with SNAP and later modified it by hand in order to make it easier to later GPT processing, it is attached to this post and will be detailed in a moment. Using graphical SNAP client’s batch processing menu yields expected output.
Now I need to automate the process using GPT. As mentioned, the graph is modified, so that inputFile and outputFile variables can be given from comand line:
gpt $GRAPH_FILE -PinputFile=$INPUT -PoutputFile=$OUTPUT
When run, this line outputs no error. The resulting file however differ from the one acquired from SNAP’s interface (using the same graph and input, in batch processing mode). I show you this below:
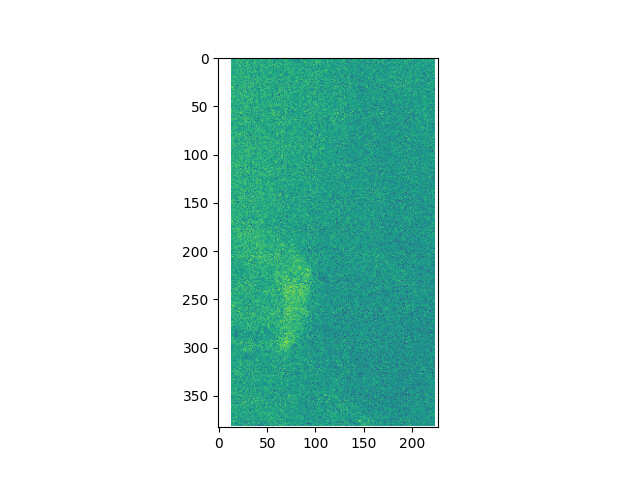
SNAP Interface batch processing output (as expected)
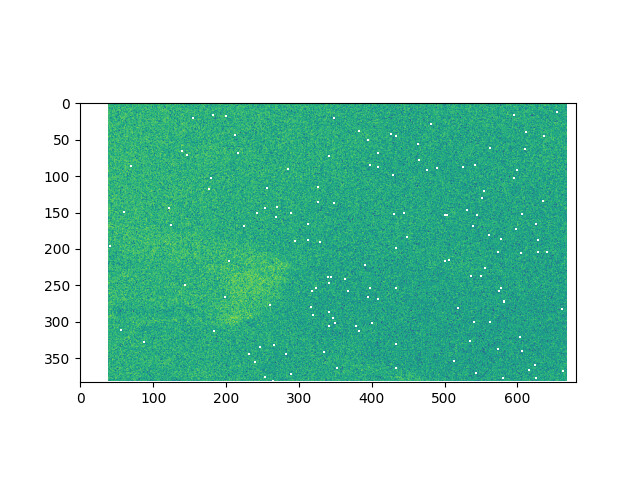
GPT Interface output (wrong)
What is wrong:
- masked points in the middle of the data;
- output dimensions are not common to a split S1 IW SLC processed image.
Just by experience I guess GPT is not doing the multilook step properly (horizontal dimension differs from one output and the other). Maybe there is something to do to NetCDF writing, but I do not know exactly how I came to this thought…
Graph file
The graph developed reads an input Sentinel-1 IW SLC file, applies orbit file, does radiometric calibration, file, deburst and multilook, to finally convert the output to dB and save it as a NetCDF4 (we tested both NetCDF-CF and NetCDF-BEAM with the same results discussed above). The graph can be downloaded below:
s1_iw_slc_2_nc.xml (3.0 KB)
Final note
I previously created a topic on this here, but my description of the problem was not proper, since at that time I thoght these blank pixels in the middle of the image were NaNs, while they are actually just 0 valued masked pixels.