Dear community,
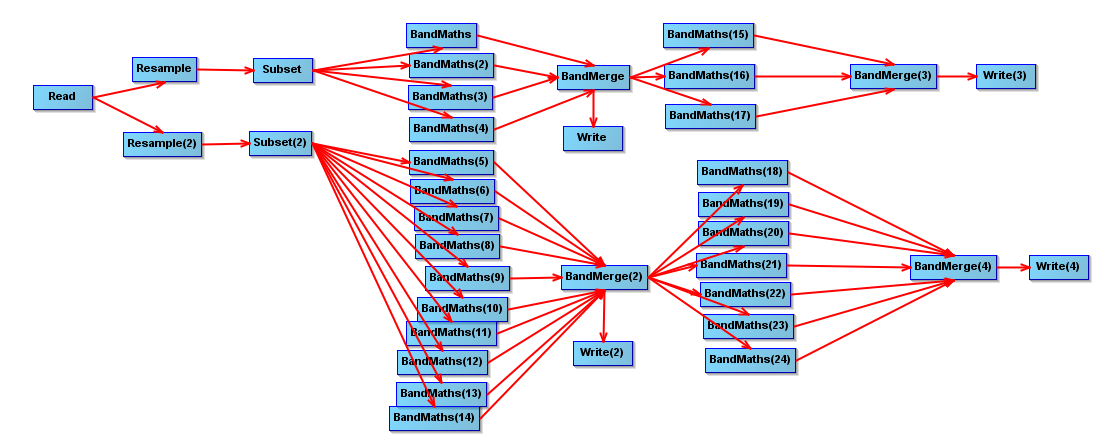
I’m currently working with Sentinel-2 surface L2A product. I have a time series of two year growing seasons, and I’m planning to compete the time series with this (2020) year too. Therefore I decided to build a graph builder (screenshot attached) to run in batch. A brief description of what the graph does:
- it reads the S2 LA2 image
- it resamples the image to both 10m and 20m
- it creates a subset to a specified AOI
- it applies both clouds and cloud shadows masks (removing them)
- it merges the new bands (i.e., stack)
- it writes out the outputs for both the 10m and 20m resampled images
- it calulates various vegetation indices (e.g., NDVI, EVI, etc.)
- it merges the new VIs bands (i.e., stack)
- it writes out the final outputs for both the 10m and 20m images
Now, the graph works perfectly! However, I’d like to know if I can improve it in some ways (maybe reducing the steps), or if you think I’m missing something.
Also I’d like to know if there is a way in SNAP to export some statistics (e.g., mean, standard dev.) of time series VIs applied to shapefiles. I tried to use the “Time Series” toolbox, but I didn’t figure out how to get the graph for the shapefile I imported.
Sincerely,
Piero