Hello.
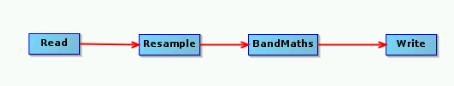
I work with a time series Sentinel 2 and I want to create a graph in order to start the batch processing. I wrote read resample (setting the parameters), write and up to this level I like the result. But I would like to add some math band to the file that is resampled. How to proceed?
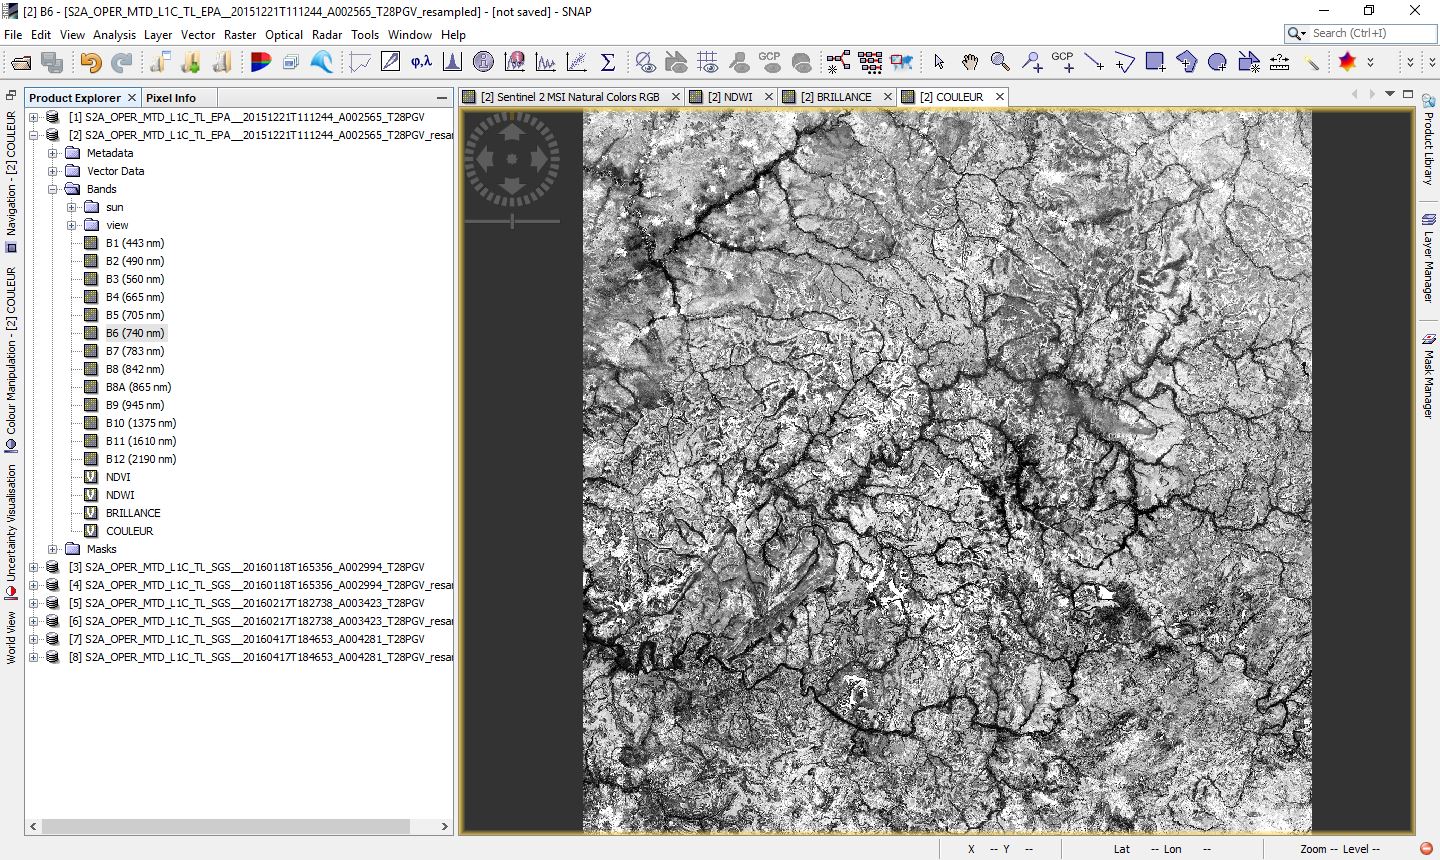
@MCG yes I do it and I have one file resampled and another file with my bandmaths.
I want to have all bandmath in a resampled data like this
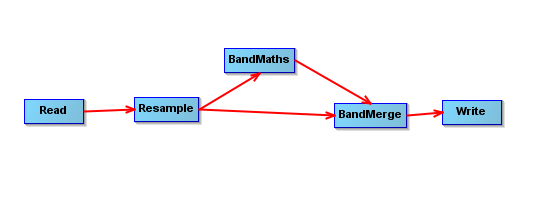
You could use the BandMerge operator in your graph: