Not sure it this is the right subforum. It is however graph-related, so here it goes.
I want to export an rgb image of a sentinel 2 product using a graph that yields the same result as doing the following on the GUI: select B2, B3, B4, open an RGB window, then save view as image.
My current graph subsets B2, B3,B4 and saves as png. However, the image looks grayscale and extremely dark. Information is there, though, and can be seen after tweaking levels on an editor.
Hi there. I’m chasing down a similar question, and came across your post. In my instance, my graph does some processing and I then want to save the produced image as a PNG file. I’ve got no problem saving it in BEAM-DIMAP format, but gpt throws an error when I attempt to write it in PNG format. How did you successfully save it as a PNG?
As for your query, you can use pconvert after saving in BEAM-DIMAP format to generate the image and apply a colour palette. For instance pconvert -b 2,3,4 -c colour-pallette-file -o output-file input-file.dim. This is what I’m doing now, but would rather save directly as a PNG (which you’re doing, albeit without the colour - which I’ll try to sort out once I can export as PNG)
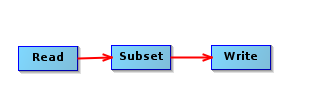
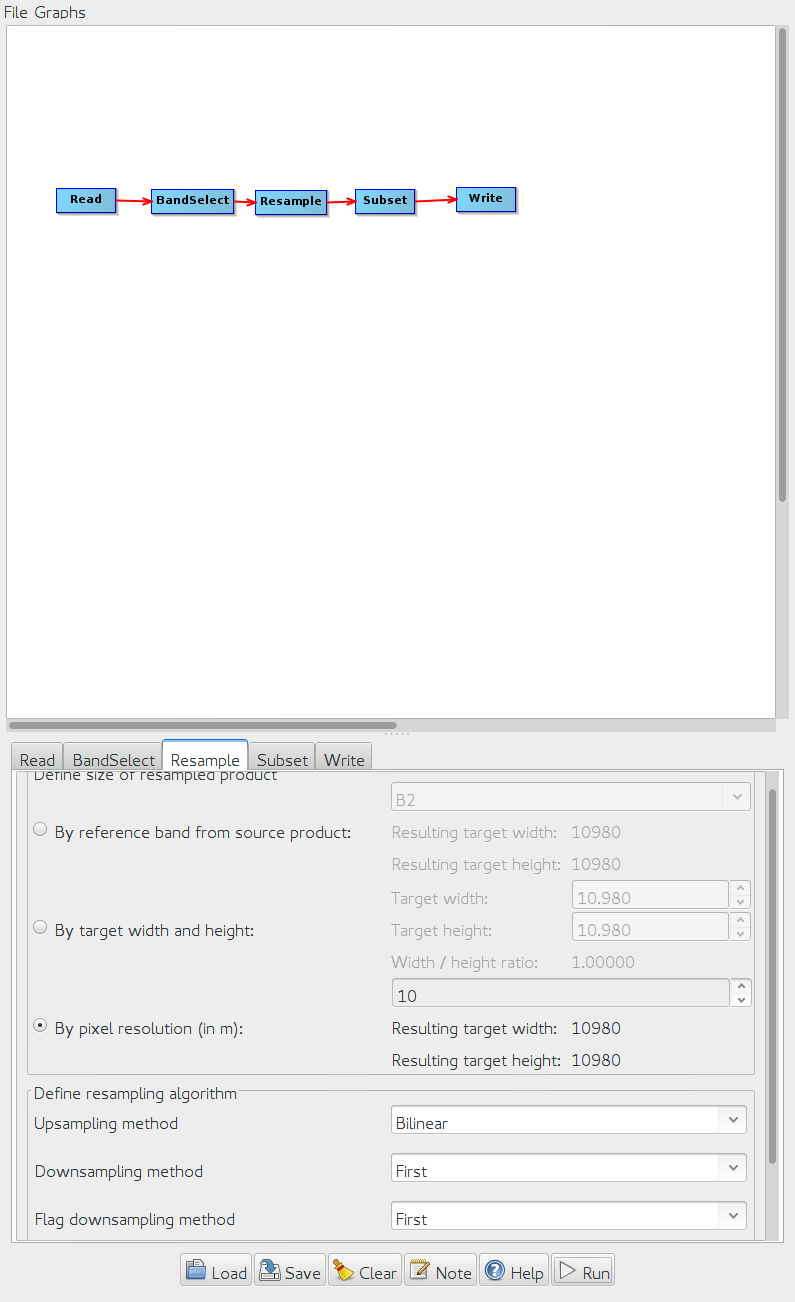
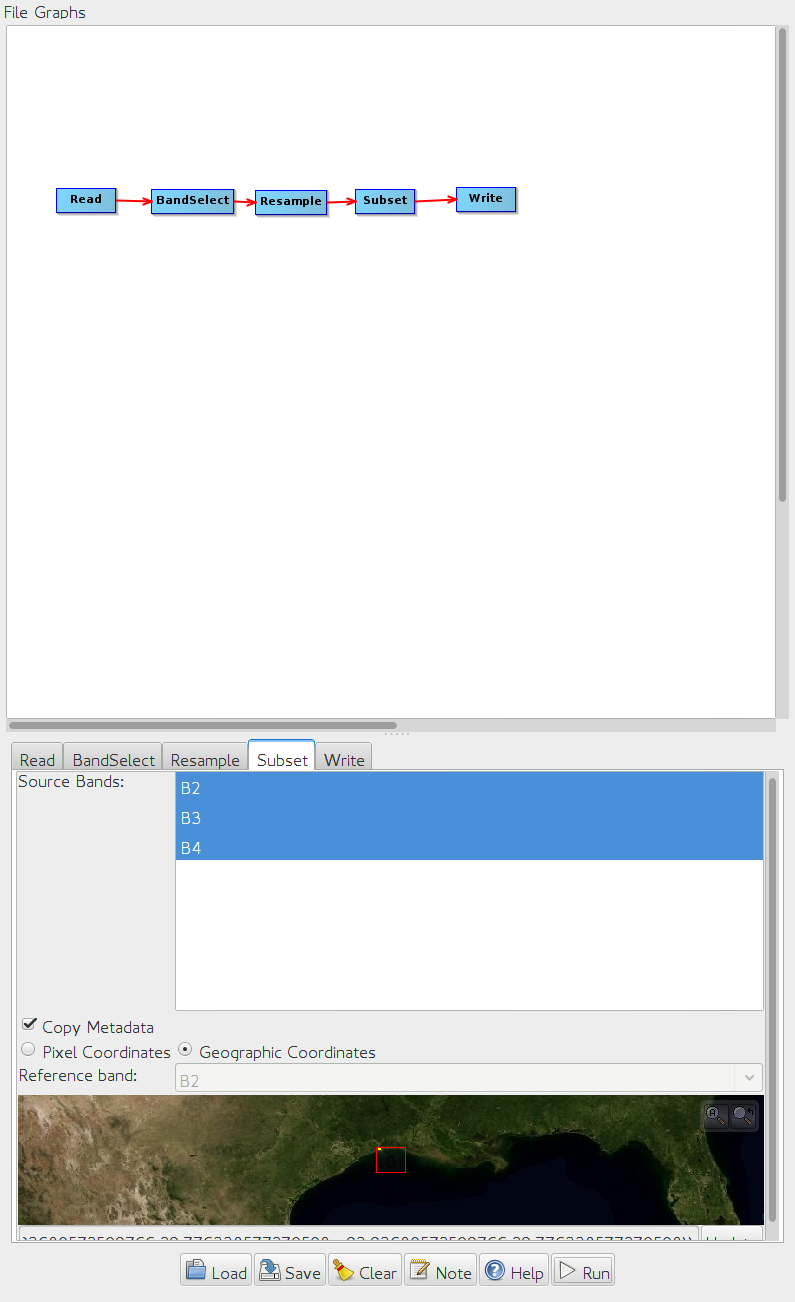
These are the steps. I use Subset to select a roi. Resample might not be required, but doesn’t hurt either. As I said, it works but the output does not look like rgb.
Another workaround would be to save individual bands, the use OpenCV or PIL to merge into an rgb
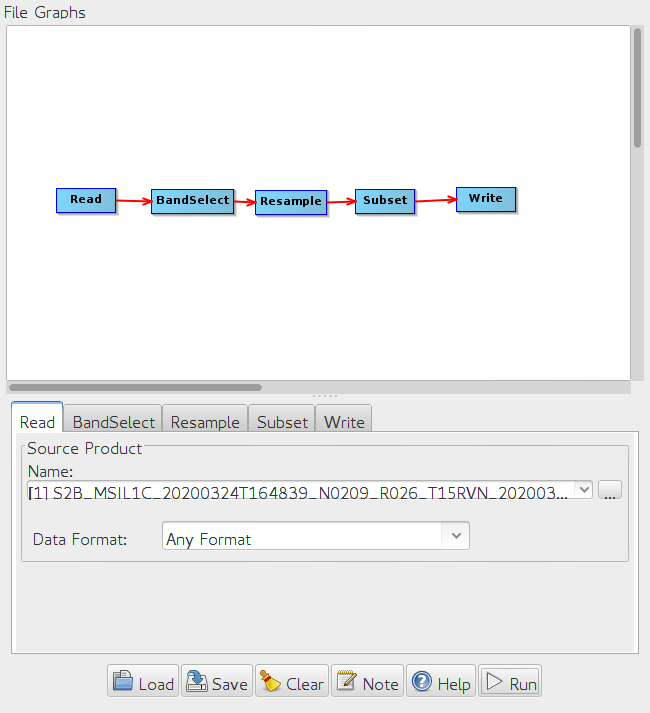
My process is similar - read the product -> resample -> import a vector -> subset -> mask -> c2rcc.olci (manually added as it’s not in graph) -> import vector (it’s gone after c2rcc) -> mask -> -> reproject (necessary for our process, as c2rcc.olci seems to change the projection) -> write.
This works just fine if it is written to BEAM-DIMP, and I can use pconvert to get the image I want, however the image does not match the the original in SNAP (in fact, after reprojecting it does not - which is a separate issue). If I then change the write format type to PNG, it throws the error:
Error: org.esa.snap.core.gpf.OperatorException
SEVERE: org.esa.snap.core.util.SystemUtils$SnapImagingListener: JAI error occurred: 'Problem occurs when computing a tile by the owner.' at com.sun.media.jai.util.SunTileScheduler@5206552
Just in case anyone reads this thread in the future. Snap graph seems to output a single channel 16-bit png. I had to generate one image per channel and stack them together. Some data rescaling is required.