Currently attempting to transition SBAS from StaMPS to another solution in order to avoid having a Matlab license. I know PyRate is supposed to be supported by SNAP in the future, but currently MintPy claims to support SBAS using SNAP.
Does anyone have a tutorial for preparing SBAS interferograms in SNAP for MintPy? I found this but it’s not very complete.
I also found this example of Master-Slave interferogram preparation, is this supposed to mean that for SBAS in MintPy using SNAP we have to generate interferograms with the next 3 acquisitions?
This seems tedious, any way to automate this data preparation like the Snap2Stamps or INSAR_G2S scripts for SNAP / GMTSAR -> StaMPS??
Hi @SteffanDavies,
I’ve been experimenting with MintPy and I got it to work with SNAP 7 in a Windows environment. Sharing some tips to raise awareness for MintPy 
They have the steps outlined here:
Using those steps, each date should have 3 slave images to create a network. The slave images should be the next 3 images in the timeseries. Something like this:
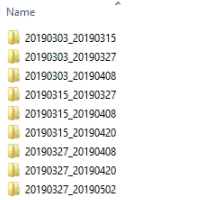
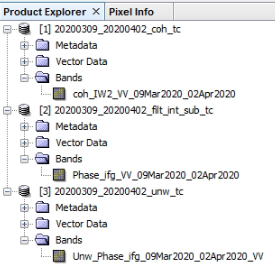
Inside the folders there should be .dim and .data files. However, the .dim files should only contain one piece of data per input. Something like the image below:
1 Like
thank you for sharing. Are you happy with the results?
When I use their provided SNAP sample dataset it works fine. I’m happy I got it to work in a Windows environment (the instructions for Windows were non-existent)
However, when I’m running my own analysis and preparing my own dataset on Taal Volcano deformation using the steps provided I have very low temporal coherance. The instructions were very general so I’m still experimenting. I was advised to try increasing the number of looks and filtering by the author, but I’m also working on incorporating a mask to remove inland lakes which are a source of low coherence.
Output with temporal coherence mask (sample point is far away from volcano):
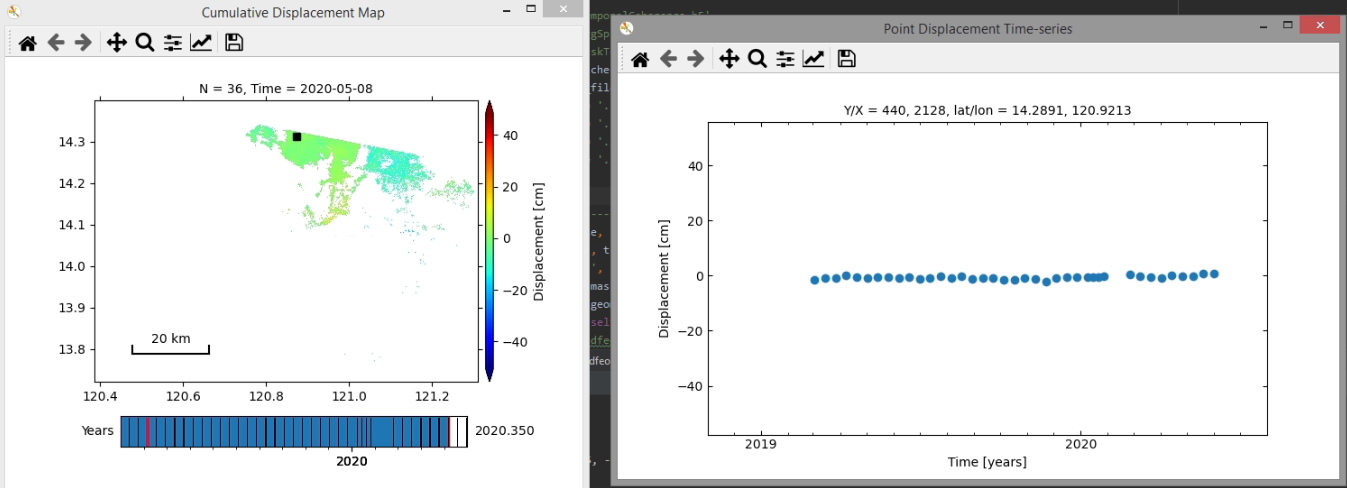
Output with no mask (sample point is near volcano):

1 Like
Very interesting and thank you very much for sharing.
I am interested in learning the SBAS or PSI method.
Until now, only interferometric pairs will be made. How do you recommend me to start to get to make speed maps of subsidence subsidence?
My study area includes city and agricultural areas.
MintPy could be a good solution?
Interesting work. If I may ask, how did you get MintPy to work on windows? Right now I must prepare the input data on Snap windows version, then restart the system into Linux to import the data into MintPy. Also, how is the arrangement of input dates be prepared? I have noticed in your data that you have 1 master image date with three slave image dates. is there a guide on how to arrange and prepare the data for MintPy? This workflow SNAP input data · insarlab/MintPy Wiki · GitHub
doesn’t answer my question unfortunately.
You just go through the standard interferogram and phase unwrapping process but the minimum final outputs need to be terrain corrected phase, phase unwrapped, coherence imagery.
To be clear the process is:
- Apply Orbit (Master and slave)
- TOPS SPLIT (Master and slave)
- Back geocoding
- ESD
- Interferogram
- Deburst
- Topophase Removal
- Goldstein filter
- SNAPHU Unwrapping
- SNAPHU Import
- Terrain correction
- Extract Coherence, Phase Unwrapping, Phase imagery
Step 12 takes a long time to process. This is because the example says you need to split the DIM file so that phase, coherence, and unwrapped imagery have their own DIM file (look at my previous posts in this thread). You will also need to extract the DEM file you used for terrain correction in SNAP. There’s an option in Terrain Correction for you to do this.
This is something that needs to be done programmatically if you want to be fast. But I haven’t checked if that’s actually necessary. Maybe you don’t have to separate the files?
Anyway, you need to do this for each interferogram pair and each date will have three interferograms because of the network. So the processing requirements for this are pretty high.
Once you have the files prepared you need to prepare a MintPy config file which will tell MintPy where the files are located. Then simply load the config file when running MintPy.
Here is the expected directory structury (copied from their documentation)
# TARGET DIR STRUCTURE

# !!! ALL DATA MUST BE TERRAIN CORRECTED !!!

# ├── interferograms <-- Folder containing all interferograms
# │   ├── 20190408_20190420 <-- Folder containing interferogram pair data
# │   │   ├── 20190408_20190420_coh_tc.dim <-- DIM containing COHERENCE only
# │   │   ├── 20190408_20190420_coh_tc.data
# │   │   │   ├── coh*.img
# │   │   │   ├── coh*.hdr
# │   │   ├── 20190408_20190420_filt_int_sub_tc.dim <-- DIM containing PHASE only
# │   │   ├── 20190408_20190420_filt_int_sub_tc.data
# │   │   │   ├── Phase_ifg*.img
# │   │   │   ├── Phase_ifg*.hdr
# │   │   ├── 20190408_20190420_unw_tc.dim <-- DIM containing PHASE UNWRAPPED only
# │   │   ├── 20190408_20190420_unw_tc.data
# │   │   │   ├── Unw_Phase_ifg*.img
# │   │   │   ├── Unw_Phase_ifg*.hdr
# │   ├── 20190408_20190502
# │   ...
# ├── dem_tc.dim <-- DIM containing DEM only
# ├── dem_tc.data
# │   ├── dem*.img
# │   ├── dem*.hdr
5 Likes
Very interesting. I’m using python wrappers for generating interferogram then snap2stamps for PSI.
How can I use this python wrappers processed Sentinel data set in MintPy.
Thank you.
I do appreciate how you have clarified the workflow.
I was going to do a test to see if the process will go smoothly, yet I didn’t quite understand how each date will have three interferograms? I usually create an interferogram from image pairs with minimum temporal baseline.
That’s the requirement for the MintPy algorithm. You can explore the sample dataset here which was prepared by the authors themselves (500 MB):
This sample dataset has been prepared using SNAP and can be processed by MintPy already.
@suribabu To my knowledge there is no Python wrapper for MintPy yet. I don’t think SNAP2StaMPS will work for MintPy.
3 Likes
Please tell me solution for this, while running SNAP processed example (Example datasets - MintPy) file in MintPY. I’m getting below error
FileNotFoundError: [Errno 2] No such file or directory: ‘./inputs/ifgramStack.h5’
I checked the file in inputs folder but it is not presented.
Please share what you have done so far and what file did you use so I can understand.
You need to process the sample SNAP data using MintPy using the smallbaselineApp.py file. I think the author also prepared the configuration file WCapeSenAT29.txt. Just double check the paths are correct in the config file. You can run the analysis using the following command in the terminal (just fix the paths so they are correct for your computer):
python smallbaselineApp.py <path_to_config_file> --dir <output_directory>
You will also need to create an account at the Climate Data Store and get the API key so MintPy can download the files for tropospheric correction.
After that you can view the timeseries data using tsview.py or view.py.
1 Like
Thank you so much. That error is resolved I’m getting one more error while running the example file in MintPy. (In output directory some files are created)
(mintpy) rakesh@rakesh:~/WCapeSenAT29$ smallbaselineApp.py /home/rakesh/softwares/tools/MintPy/mintpy/inputs/WCapeSenAT29.txt --dir /home/rakesh/WCapeSenAT29/output
tropo_pyaps3.py -f /home/rakesh/WCapeSenAT29/output/timeseries.h5 --model ERA5 -g /home/rakesh/WCapeSenAT29/output/inputs/geometryGeo.h5 -w ${WEATHER_DIR}
weather model: ERA5 - dry (hydrostatic) and wet delay
weather directory: /home/rakesh/WCapeSenAT29/output
output tropospheric delay file: /home/rakesh/WCapeSenAT29/output/inputs/ERA5.h5
output corrected time-series file: /home/rakesh/WCapeSenAT29/output/timeseries_ERA5.h5
read dates/time info from file: /home/rakesh/WCapeSenAT29/output/timeseries.h5
time of cloest available product: 18:00 UTC
Traceback (most recent call last):
File “/home/rakesh/softwares/tools/MintPy/mintpy/smallbaselineApp.py”, line 1268, in
main(sys.argv[1:])
File “/home/rakesh/softwares/tools/MintPy/mintpy/smallbaselineApp.py”, line 1250, in main
app.run(steps=inps.runSteps)
File “/home/rakesh/softwares/tools/MintPy/mintpy/smallbaselineApp.py”, line 1054, in run
self.run_tropospheric_delay_correction(sname)
File “/home/rakesh/softwares/tools/MintPy/mintpy/smallbaselineApp.py”, line 810, in run_tropospheric_delay_correction
tropo_pyaps3.main(iargs)
File “/home/rakesh/softwares/tools/MintPy/mintpy/tropo_pyaps3.py”, line 784, in main
get_grib_info(inps)
File “/home/rakesh/softwares/tools/MintPy/mintpy/tropo_pyaps3.py”, line 266, in get_grib_info
inps.snwe = get_snwe(inps.atr, geom_file=inps.geom_file)
File “/home/rakesh/softwares/tools/MintPy/mintpy/tropo_pyaps3.py”, line 393, in get_snwe
lat0, lat1, lon0, lon1 = get_bounding_box(meta, geom_file=geom_file)
File “/home/rakesh/softwares/tools/MintPy/mintpy/tropo_pyaps3.py”, line 457, in get_bounding_box
if not meta[‘Y_UNIT’].lower().startswith(‘deg’):
KeyError: ‘Y_UNIT’
Maybe your geometry data is corrupted. Did your try deleting all your output data and starting again? Sometimes when I have errors like that I have to restart my MintPy analysis and it fixes my problems.
1 Like
I got solution for this bug. Please find the below.
2 Likes
That’s great! I did not have that bug yet maybe because my MintPy version is a bit old. I have to update mine 
Hi everyone,
NASA has just uploaded their webinar about their Vertex tool which processes Sentinel-1 InSAR in the cloud for free. It is specifically configured for SBAS analyses and they mentioned that this is can be compatible with MintPy. They give you 1000 free image pairs to work with each month ![]()
If anyone is having trouble preparing data for MintPy maybe this can work. Just a disclaimer: I haven’t tried this data in MintPy myself.

4 Likes
Thank you for your valuble information
Thank you for sharing. I agree, if anyone manages to prepare the data for MintPy based on the export from ASF, I would be interested in the steps.
I’ve had some time to explore some sample data near London and here is what I found so far:
- The ASF/MintPy integration works but it’s not 100% done. There is on-going discussion on how to finalize the integration (Link)
- MintPy expects the same array size. There is a library provided from ASF that can do this for you.
-
EDIT: This issue was actually another unrelated error. disregard this point.
If you are subsetting the image in MintPy, you need to select an area that is covered by all the imagery.Vertex will download imagery even if doesn’t overlap exactly. I tried getting an image near the edges but I get errors.
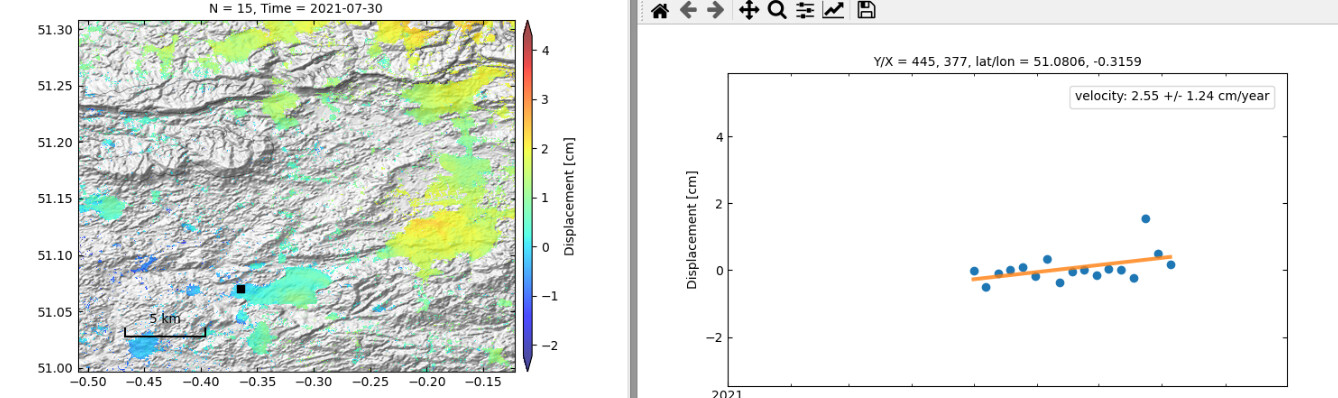
My data has some ramps in some imagery so it’s not a good result but this is just a quick demo. You can exclude dates using the config file.
Important tip: Subset your data using the MintPy config or else it will take a very long time! You will be processing 3 full subswaths of Sentinel-1 SLC data.
In the image below you can observe the darker areas which do not have images for all dates.
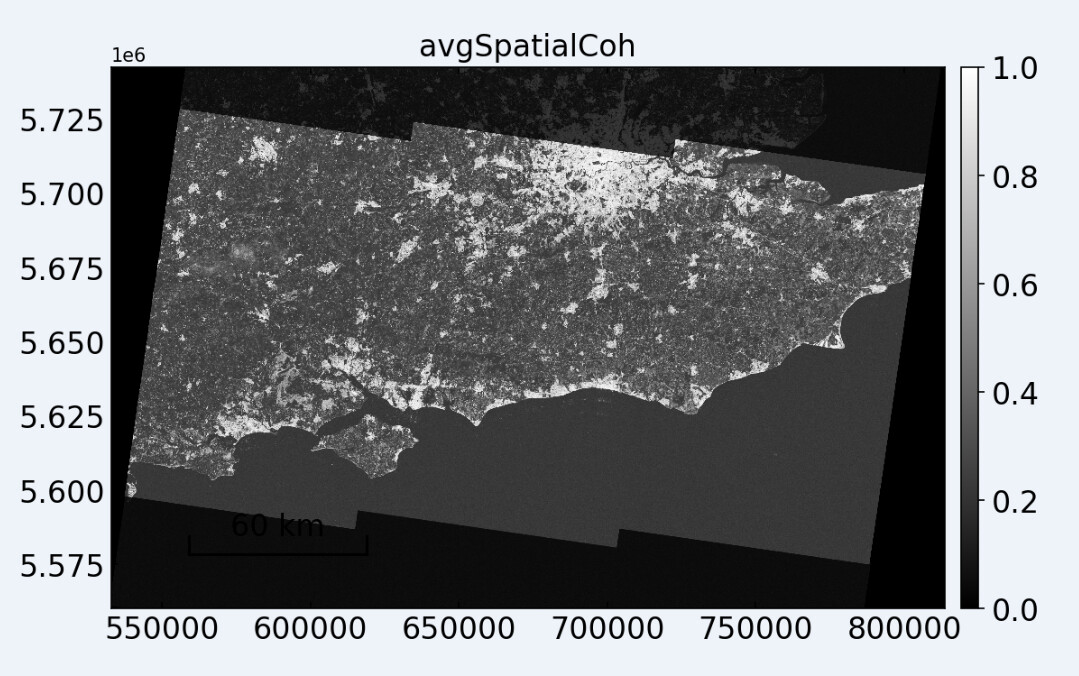
My sample data seems to have some ramps (unwrapped phase)
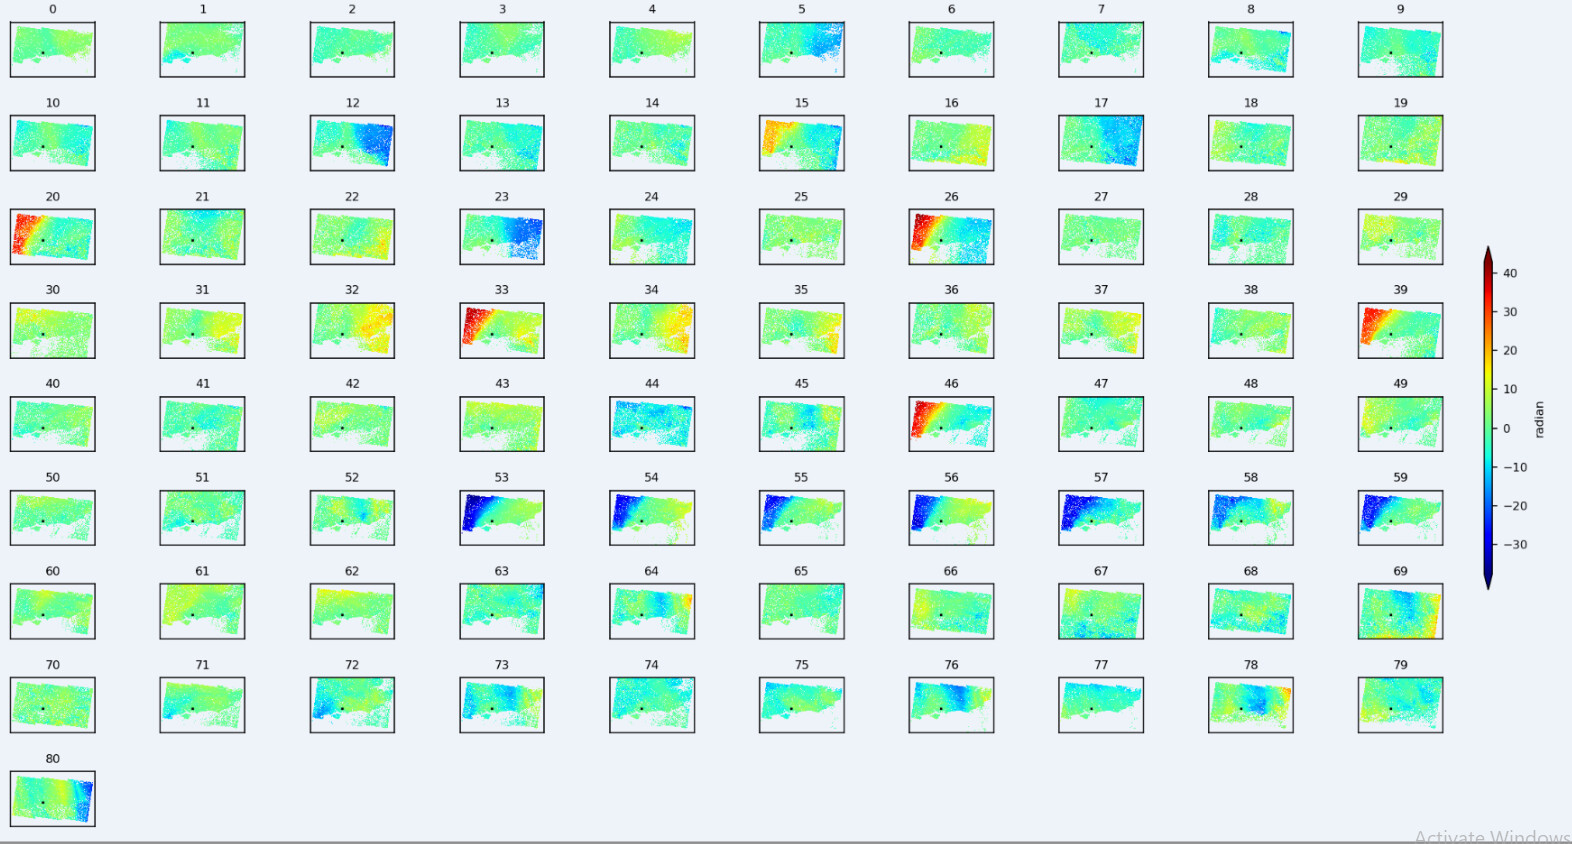
Did a separate analysis using a subset somewhere near London
1 Like