Very interesting. I’m using python wrappers for generating interferogram then snap2stamps for PSI.
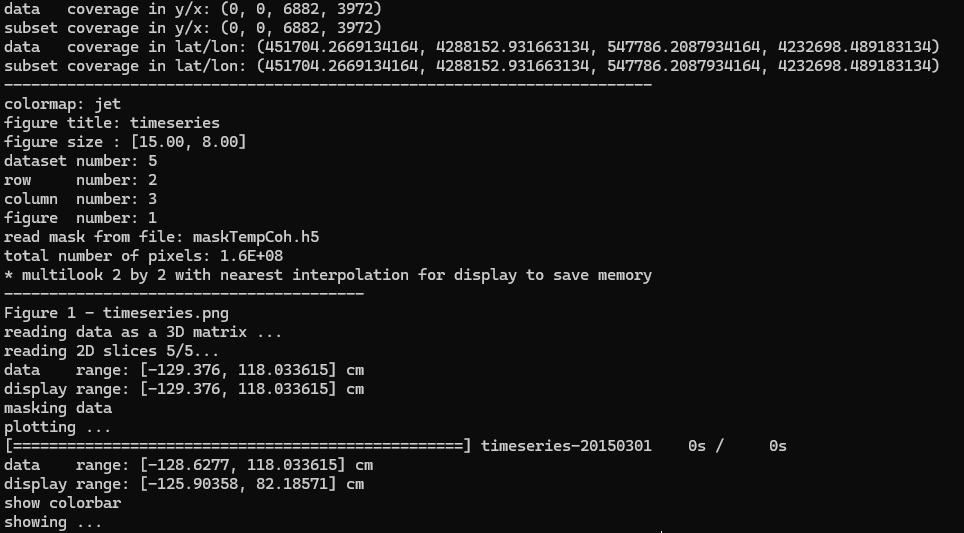
Hi everyone, I am performing time series analysis with mintpy in the windows operating system. I have produced the files, but when I want to visualize the time series.h5, avgPhaseVelocity.h5 files using the view.py or tsview.py commands, it remains as in the visual and does not result. I cannot see the results with mintpy.
MintPy uses the Python library “Matplotlib” to display images and maps. It is possible that your configuration is not allowing Matplotlib to open a window. You can use the “–nodisplay --save” flags to get a PNG file created by “view.py” instead of an interactive display.
Thank you so much ![]()
