Hello everyone,
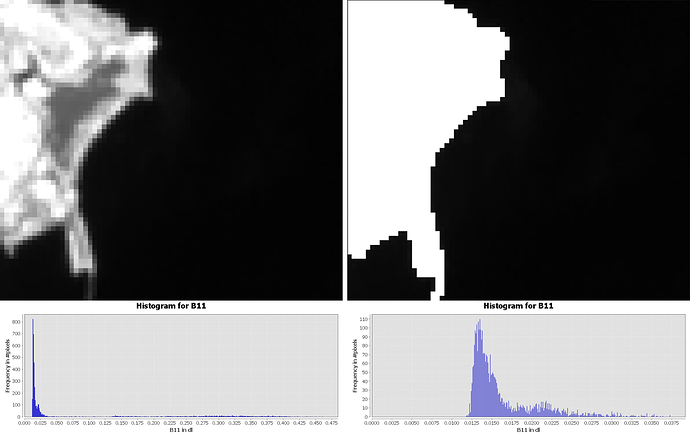
I tried masking out land pixels from a subset of a B11 image, and wanted to compare the histograms before and after. For the masking, I added the following on the “Valid Pixel Expression” : &&(B11<0.0375). The result was the following
On the left is the original subset, and its histogram right underneath. The number of pixels that have values roughly 0.0125 reaches about 800. However, after the masking, it drops to about 110 (histogram on the right). Why is that ? Am I missing some basic principle of masking ? I figured since 0.0125 < 0.0375 the number of pixels having that value shouldn’t have been affected, or at least not by that much.
Thank you for your time !
