Is there any library for the different graphs like this for the processing of sentinel -1 data?
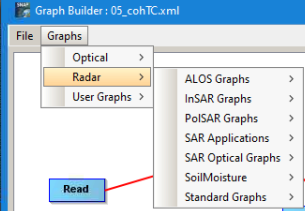
have you seen these ones?
1 Like
And you might find something in here:
1 Like
Thanku @ABraun You are really awesome.
Can you please tell me these three questions -
1.How many columns (Consist of 9 busts) and rows can we merge together using TopSAR Merge?
-
Can merge 2 or more image having swath of ~270km?
-
When should we merge images?
Thank you once again.
you can merge three sub-swaths at once when they belong to the same product. Merging should be done after interferogram formation and debursting. There is even a graph for that, but I don’t recommend using it, but rather to process eath sub-swath individually and then merge the products because this is much quicker

1 Like
Intensities are correct for split product but coh, phase of interferogram are not showing any result. I have repeated the process but still same result.

please check the product after coregistration, especially if both dates still contain image data. If you are using multiple bursts, use ESD after Back Geocoding
1 Like
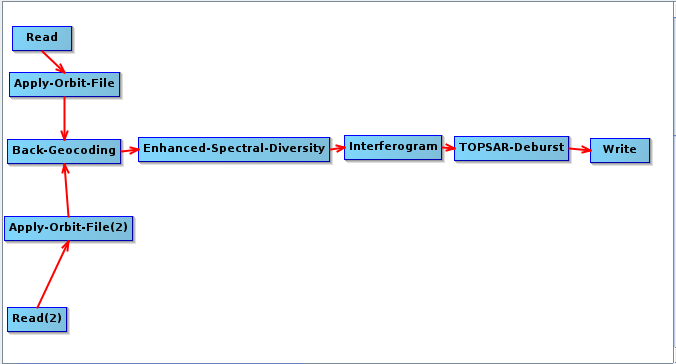
Split image is containing the intensity data, I am using this graph using ESD after Back geocoding
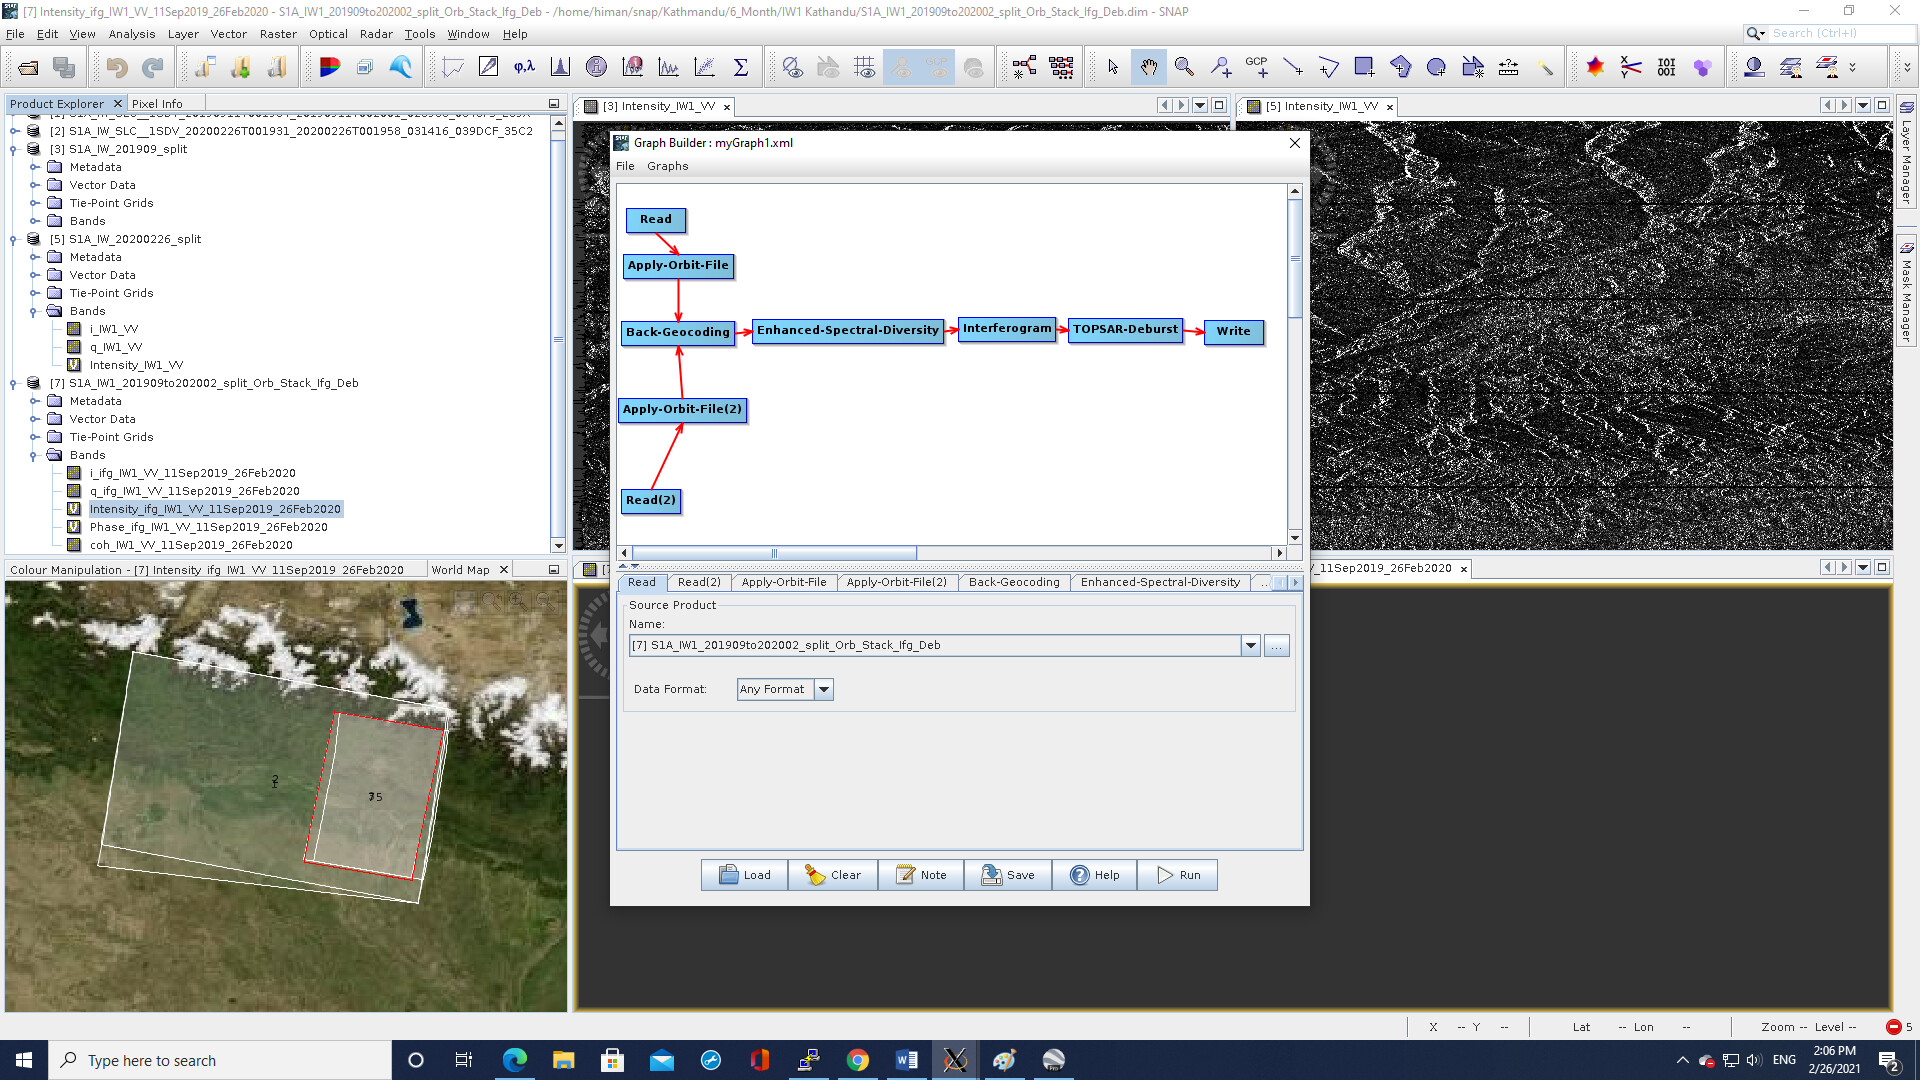
and not getting any data in interferogram.
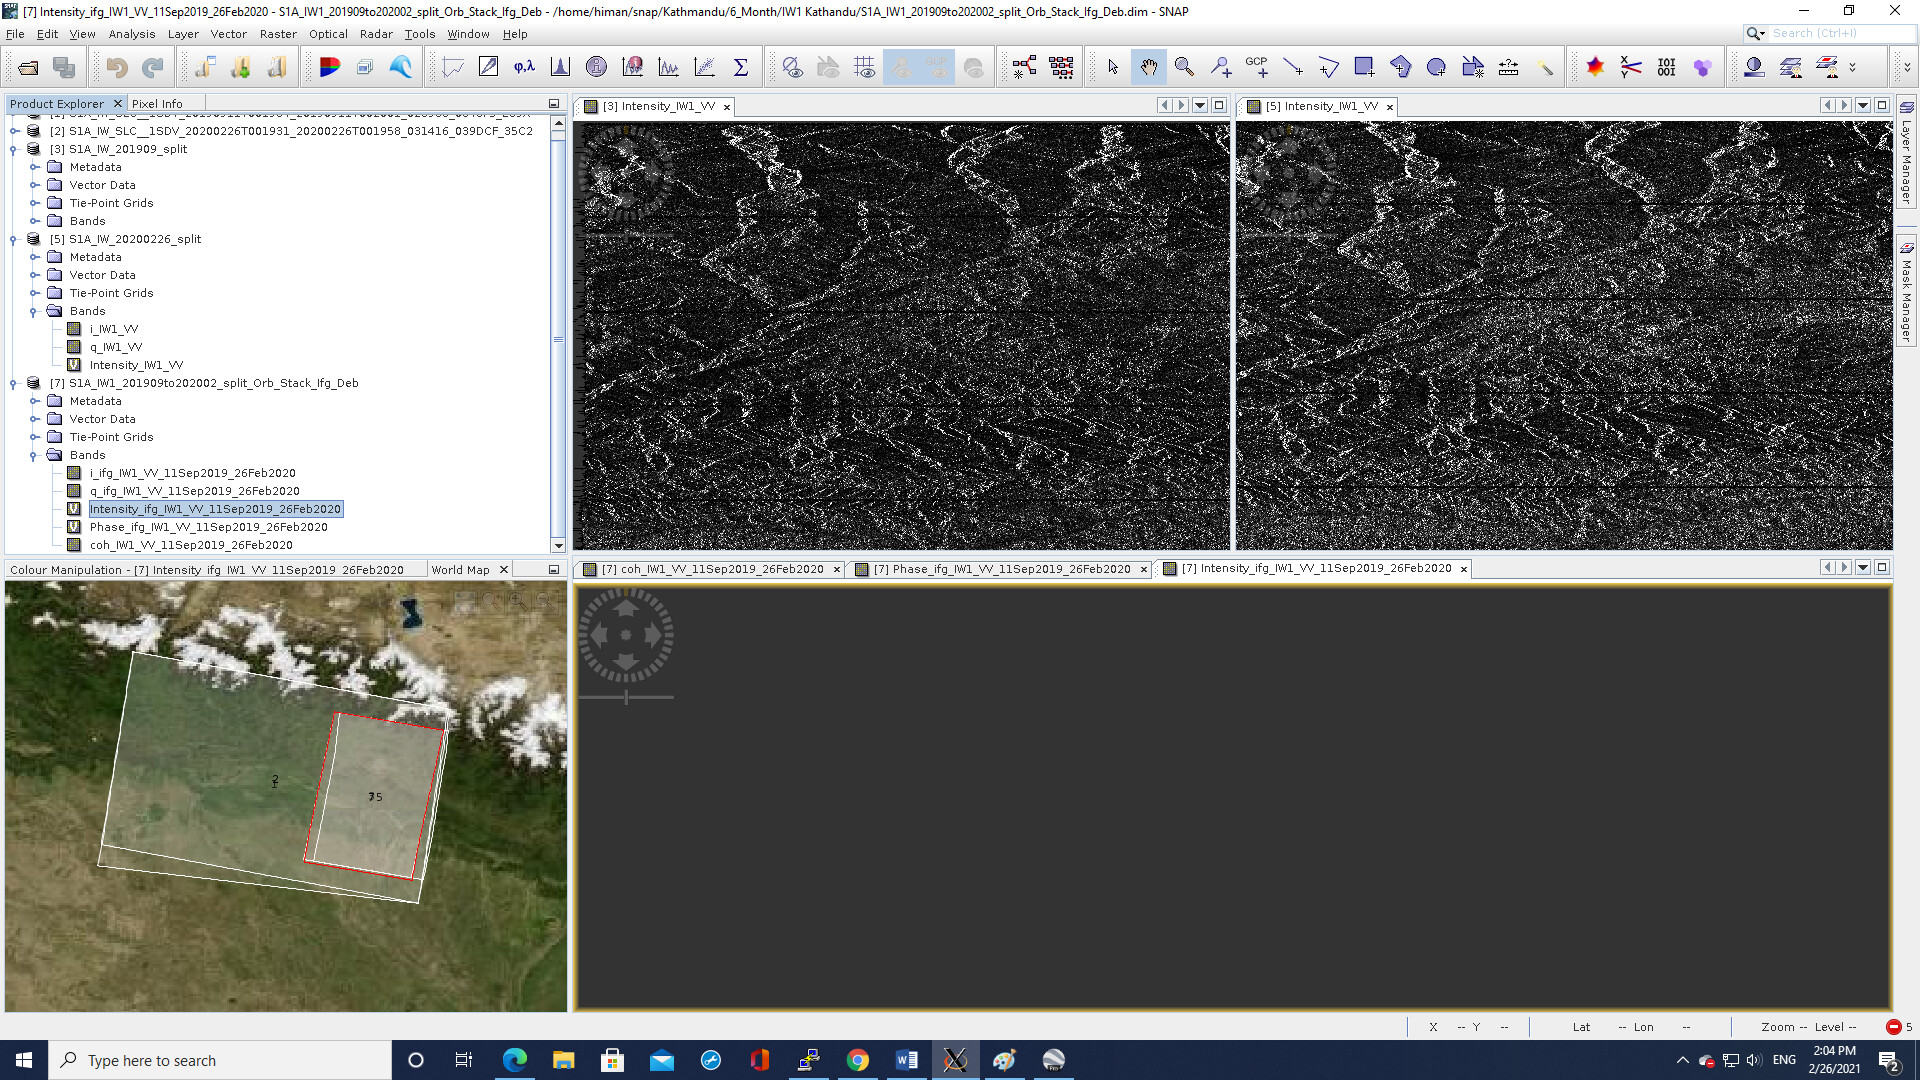
looks like the intensities after BackGeocoding are lost?
Yes, It may be. What might be the reason?
if not enough matching points are found, for example, or if the DEM used for coregistration does not reflect the patterns in the image. But more often, it is a matter of processing error.
Can you please try another DEM for a test? You can check if the coregistration was successful by creating an RGB image as shown in this tutorial: Sentinel-1 TOPS interferometry (page 9)
Also, if you want to analyze deformations, a shorter temporal baseline might give you better coherence.
1 Like
Dear @ABraun,
I am trying to use the TOPSAR Coreg Interferogram.xml graph to batch process numerous InSAR imagery at once for preprocessing in StaMPS. How do I use graph in batch-processing? I have one master and multiple slaves.
When I open the graph in Batch Processing, there are no Read and Read (2) windows to put appropriate master and slave images. There is only I/O parameters window. Also, I am not able to input any information in TOPSAR Split and subsequent information.
Can you please tell me how to do it? I am using SNAP 12.0.0.
We have communicated before about StaMPS to a great extent on the forum but I am using InSAR after 5 years and forgot everything. So I need to re-learn everything essentially from scratch.
Thank you!