I would like to know how can I get the real deformation of the surface with interferogramas using Sentinel 1 images, not only the LOS deformation.
I am not totally sure but I had read one time that I need both ascending and descending orbit images, but I don’t know how can I determine the deformaction using both orbits.
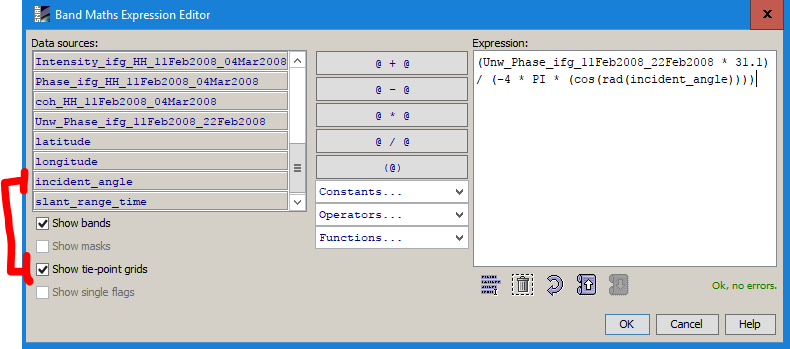
Sorry, I cannot tell by looking at the figures. This is just a simple mathematical transofrmation performed on your input values. The quality depends on the deformation pattern, the look direction, the DEM used to calculate the local incidence angle etc. So it’s mathematically correct, but if your data is not suitable (for exambe because the interferogram is noisy), the conversion will not have made it better.
The unit is the same as you defined the size of the wavelength. If you have entered it in meteters, the result is in meters. If you have entered it in centimeters, the result is in centimeters.
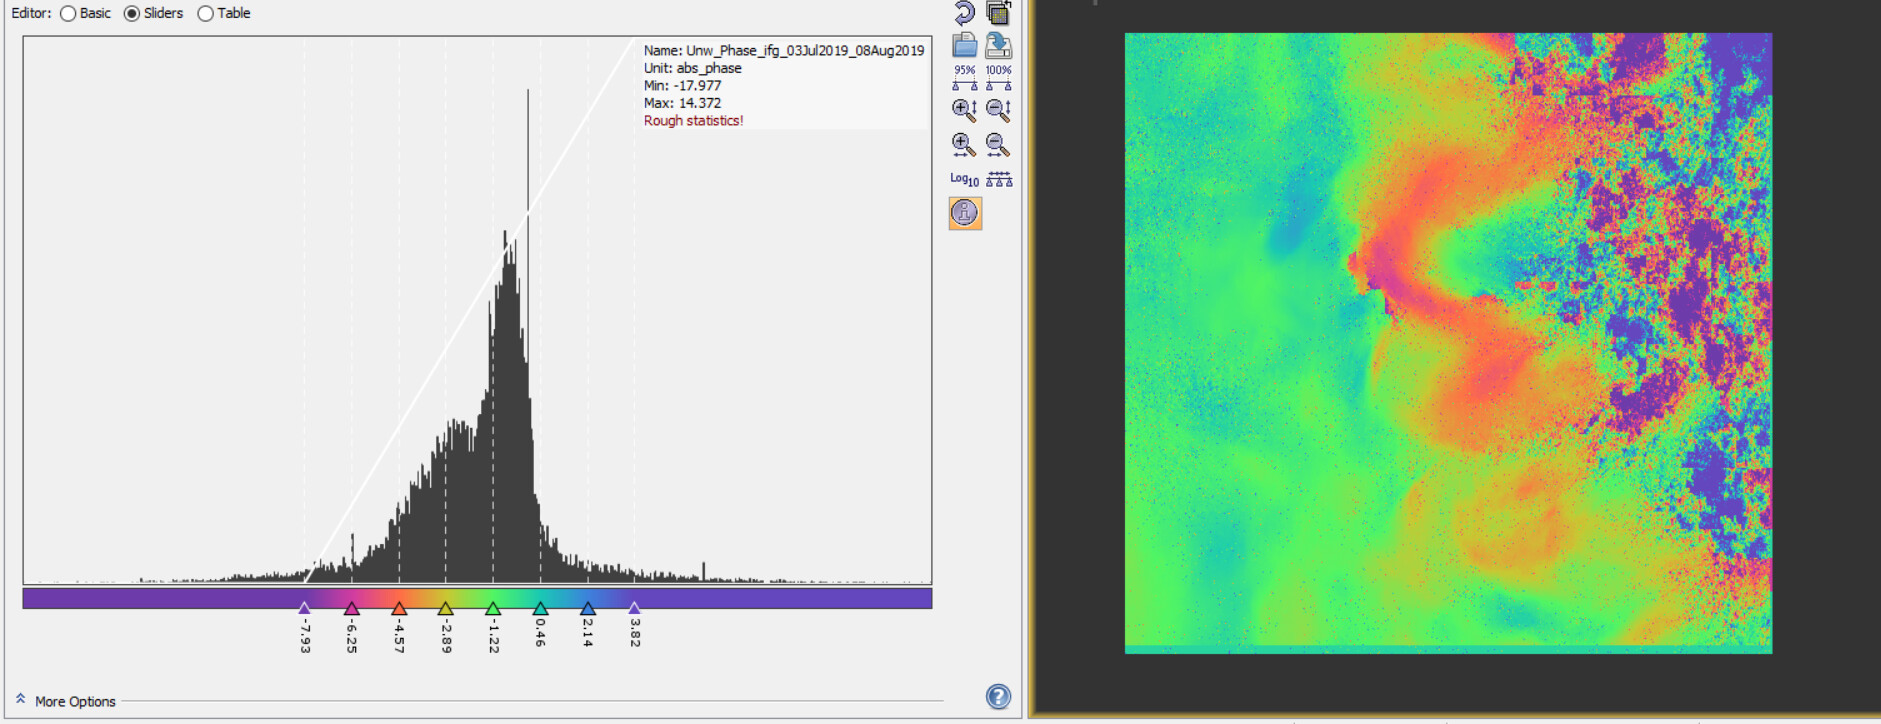
Maybe you can share a screenshot of the interferogram and tell if the pattern we observe is feasible.
1 - Imagine that I have tow displacement maps, one of them created with a pair of ascending orbit images and another created with a pair of descending orbit, I want to know the value of displacement in one pixel, in the case for one map the value is 0,02m and for the another map is 0,03m. Does exist a formula to find the vertical deformation with those values?
2 - About the coherence, this is measured in a range between 0 - 1, isn’t it? ¿since which value can I consider that the coherence is high or low?
these are discussed in the other topics. The easiest is given in this article, but you need the local incidence angle.
There is no absolute threshold, it depends on land cover, the wavelength and the duration between the images. E.g. 0.5 over forest in a Sentinel-1 12-day pair is high, but it would be suspiciously low in a 6-day pair over urban areas.
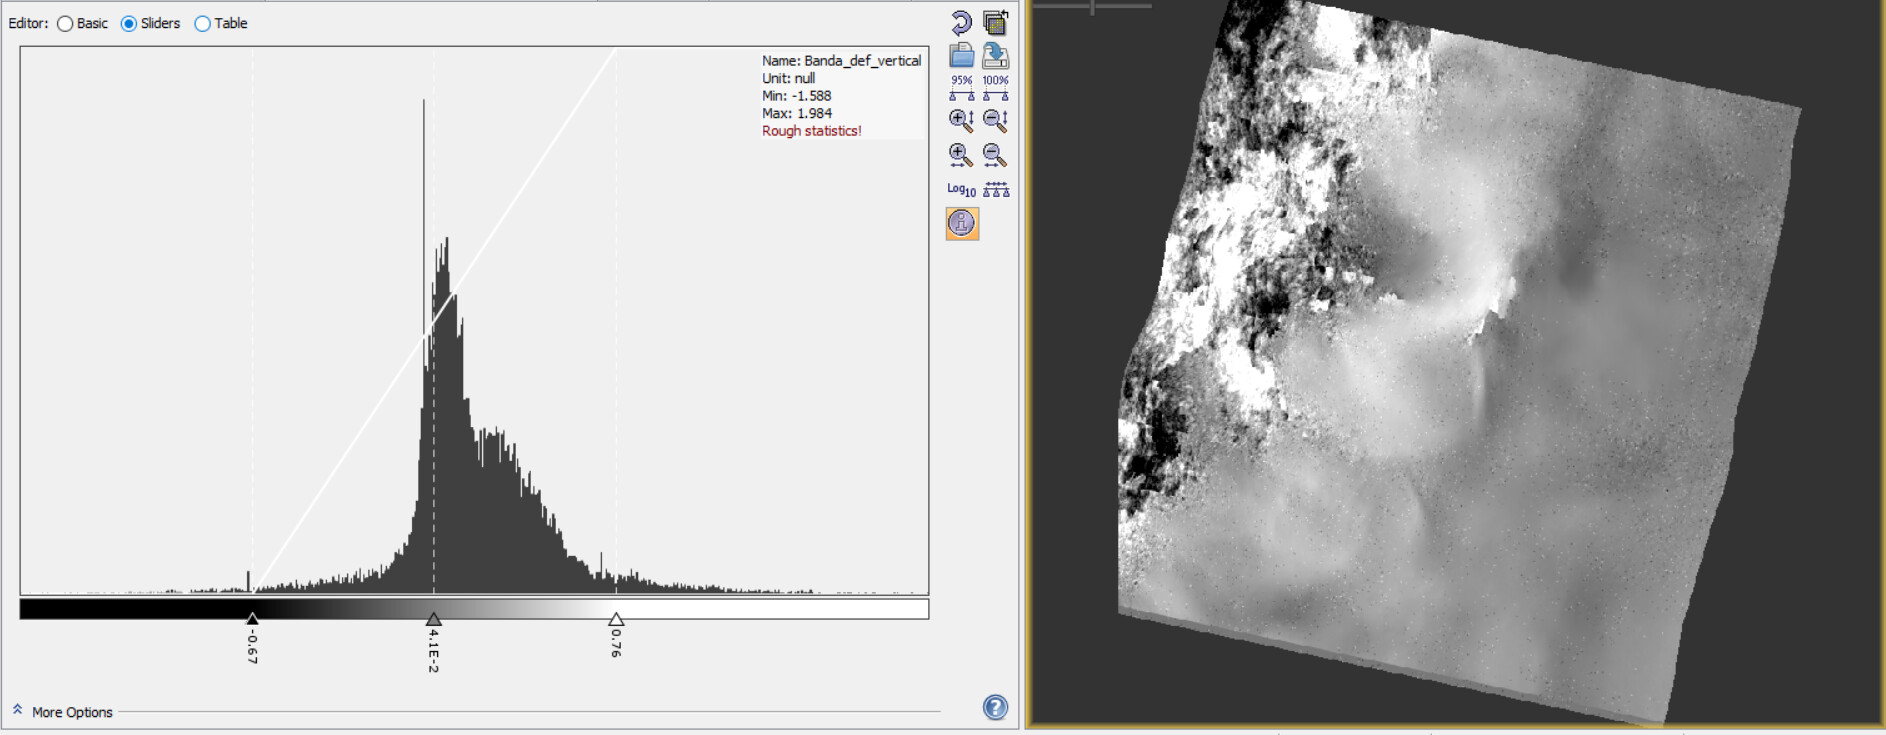
To me, the wild patterns at the left part of the (projected) image look fairly random. I don’t expect them to bec caused by real risplacement, but rather unwrapping errors of decorrelated phase. In contrast, the S-like pattern in the central could indicate some surface deformation. I don’t know, the interpretation of the results requres knowledge on the study area and the type of expected deformation.
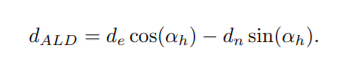
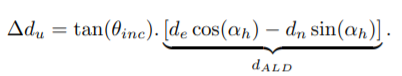
I have found the following equations in this article:
du Deformation is the vertical deformation that I need, I would know the LOS deformation, the incidence angle and the header angle, but not the ALD deformation and to know the ALD deformation I need to know the deformation in components North and East.
In this case I don’t need descending and ascending orbits LOS deformation data?
With snap can I know the ALD deformation?
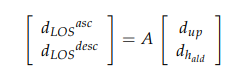
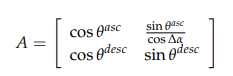
And in the article that you shared me I found the following equations:
In this case I need both orbits LOS data, but I still have problem to don’t know ALD deformation.
What can I do to solve that?
This paper may be helpful to better understand the situation:
Wright, T. J., B. E. Parsons, and Z. Lu (2004), Toward mapping surface deformation in three dimensions using InSAR, Geophysical Research Letters, 31(1), L01607, doi:10.1029/2003GL018827.