Some Sentinel-1 images may appear mirrored when opened in the Sentinel-1 toolbox. This is an effect of the acquisition geometry: the mirroring effect may be present or not depending on the combination of orbit (descending or ascending) and looking side (left or right). If an image is mirrored it is possible to flip it with the NEST toolbox using the Data Flip tool in the Utilities menu. Alternatively, the image can be flipped and, at the same time, re-projected in a desired geographic projection with the following procedure: Utilities > Reprojection > fill in the input/output boxes in the first tab and chose the projection in the second tab. Then click OK. It is recommended to launch this time-consuming process on small sub-datasets.
The orbit direction is specified in a field named pass in the xml metadata file located in the calibration sudirectory of an image product. But where can I find the looking side?
You should recall that S-1 is a radar. The geometry on which the data is provided is the most simple one if you think at it from a radar point of view. It is a collection of echoes ordered in time and this both in azimuth and range.
This is the natural geometry of the radar and the most simple one to work with to fully exploit the product.
The side effect is that indeed depending on the pass (ascending/descending) your image might appear north/south (ascending) flipped or east/west (descending) flopped!
This is therefore not an orientiation issue but a convention that is followed by ESA (for ERS, ASAR and now S_1) and most of SAR data providers with the exception of MDA for radarsat (if I am not mistaken).
If you are not interested in the SAR timing (fundamental for application like INSAR) and want to combine your data with other sources (GIS). You have two options:
a) geoocoded/ortorectify the product, as mentioned previously using SNAP or other to project the data on our favourite world reference system
b) Open it directly with a GIS (open GIS) as the product are provided in geotiff, we provide a full grid of ground control points allowing openGIS/GDAL to geocode it on the fly
a) is by far most accurate as you can use also a DEM to correct for topographic and radiometric distortions induced by topography using the terrain correction method.
Just to make sure I understand correctly, this means that for ascending passes it is looking to the East and descending passes it will be looking West? I’m assuming the right-looking direction is in relation to the spacecraft’s forward movement in orbit?
I use SNAP Graph builder named "TOPSAR Slices Coreg Interferogram for two masters and two slaves of S1 TOPS data to produce interferogram and coherence. The problem with this is that the output is un-flipped south-north. I even modified the graph to apply terrain correction. I also made another graph to do first slice assembly and then apply basic operations to geocode S1-TOPS mode data, but the result is the same. Do you have any suggestion to correct this issue?
after Range Doppler Terrain Correction, the data should be no longer flipped.
Have you tested it outside a graph by simply applying the module to your interferogram?
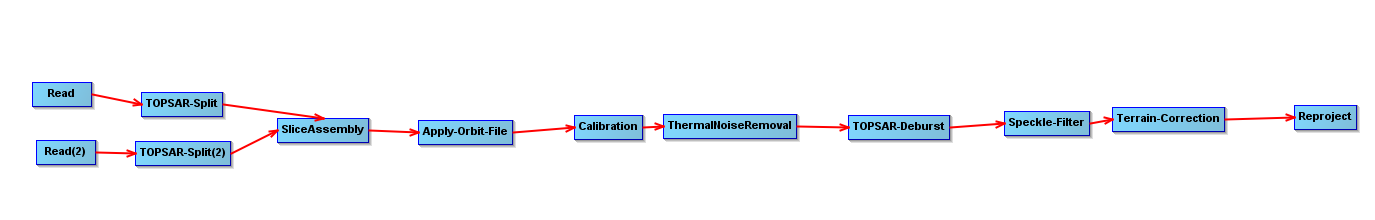
slaves_assemble_split_applyorbit_slc_grd_utm.xml (11.0 KB)
The attached is the graph builder I use for geocoding two images with assembling them before terrain correction.
Do you see anything strange in the graph?
WGS84, UTM 29N on two S1A images below. I choose IW2 among subswaths:
S1A_IW_SLC__1SDV_20150427T181400_20150427T181428_005673_00746B_0F67.SAFE
S1A_IW_SLC__1SDV_20150427T181426_20150427T181453_005673_00746B_2479.SAFE
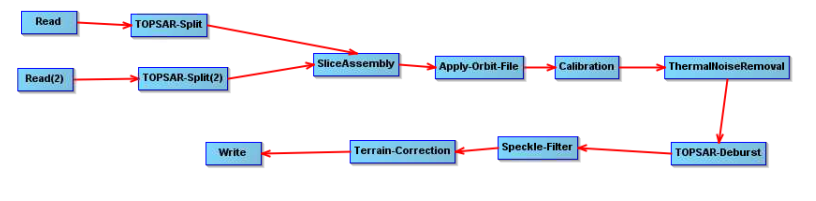
I downloaded these images and recreated your graph. The image is not flipped. You need to add a write ooperator in the end as well, otherwrise nothing will be written.
Besides that: Why do you use SLC data and not GRD? For your workflow, the result is the same and you can skip many steps (Split, Assembly, Deburst)