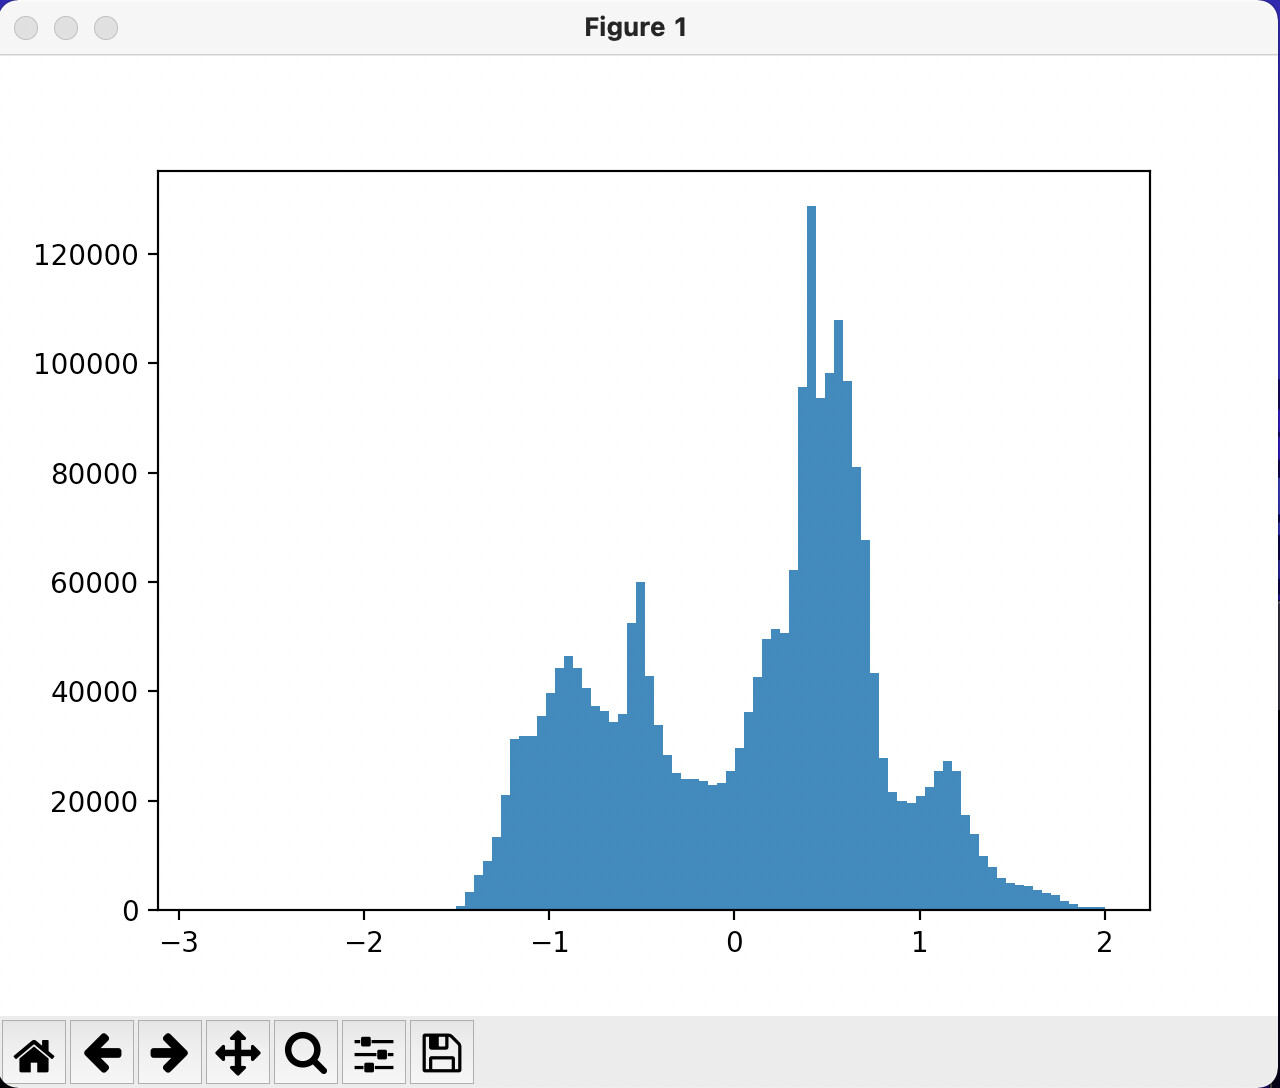
I have been working with OLCI chlorophyl concentration data and noticed that when the corresponding bands are exported to GeoTIFF, instead of the concentration values, a base 10 logarithm of the concentration is written as output.
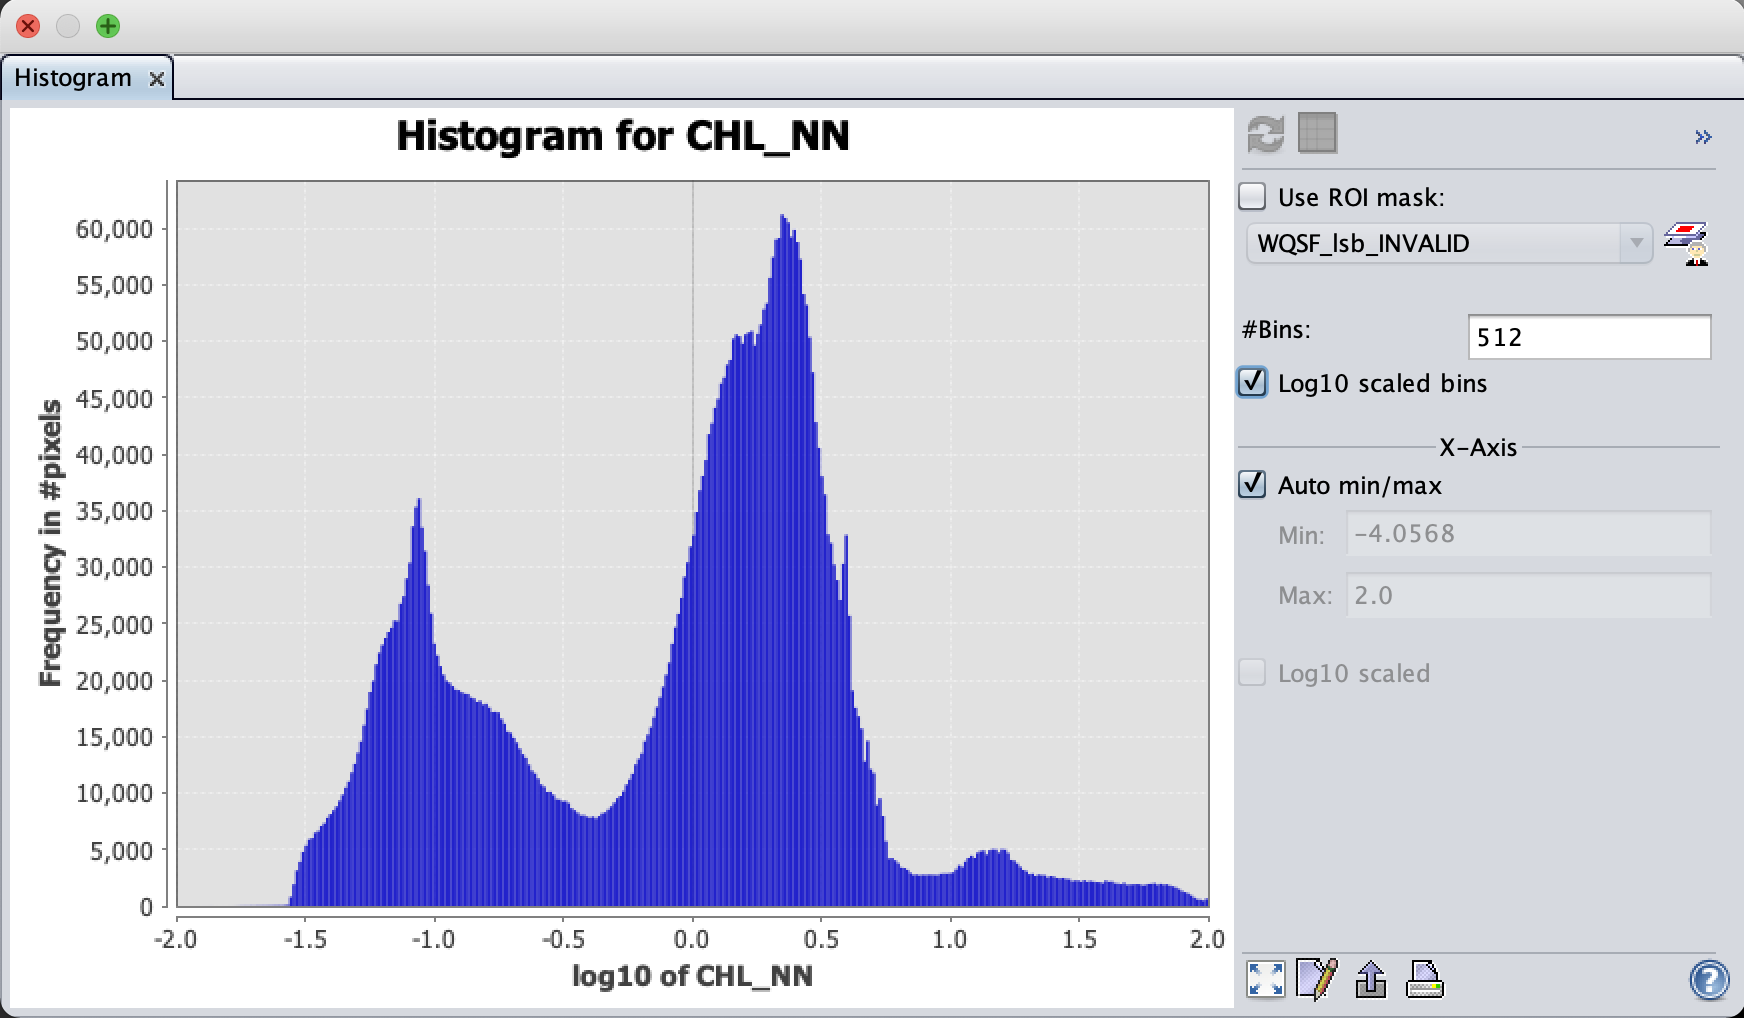
Here is how the histogram looks in SNAP with \log_{10} scaled bins:
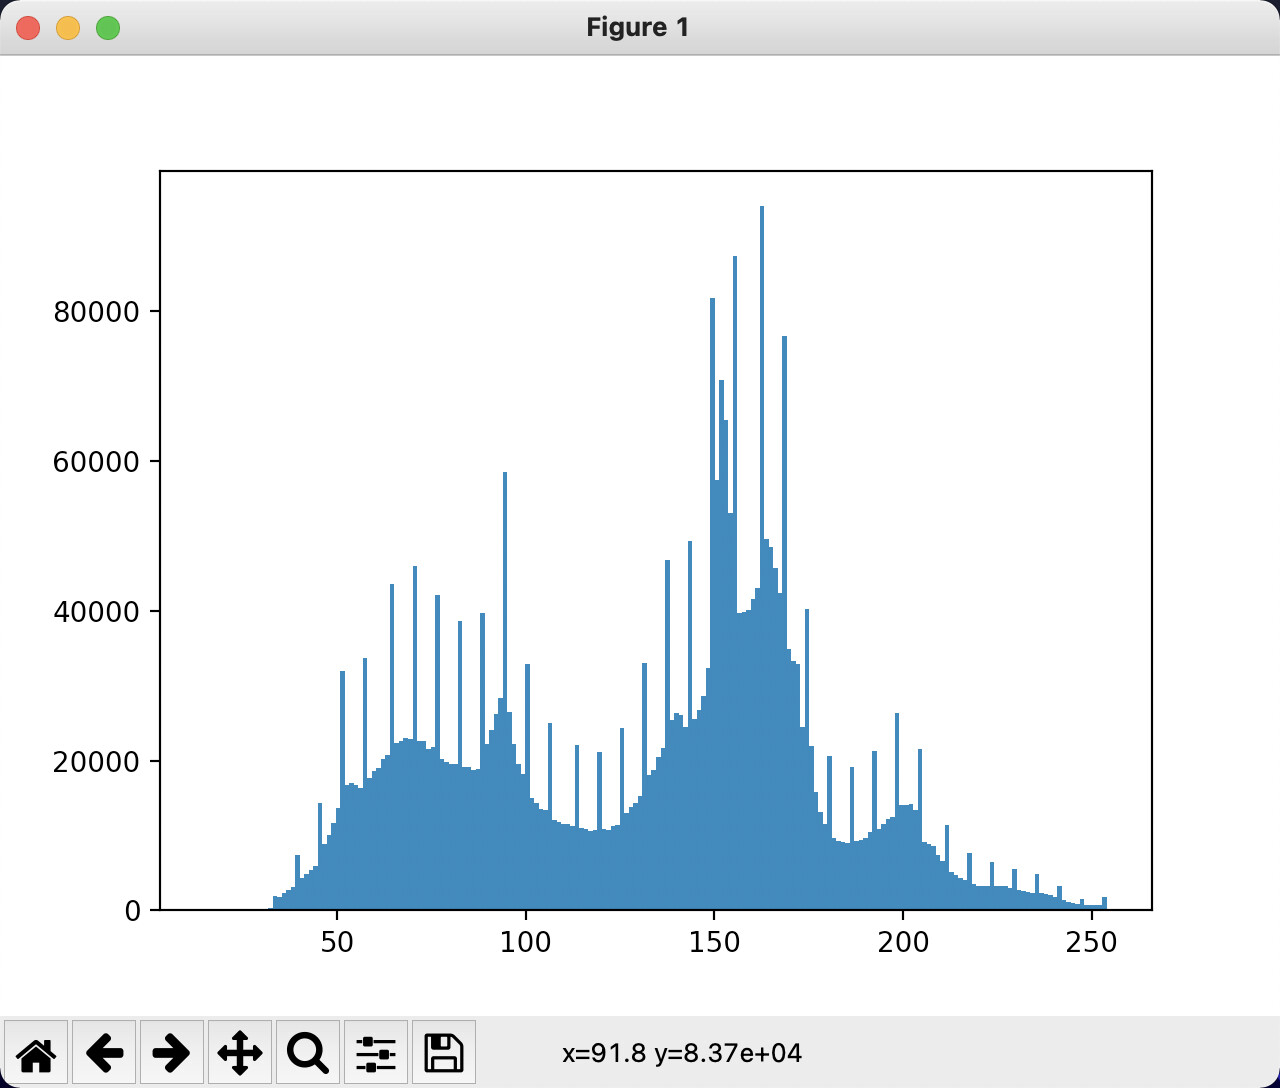
I think it is related to how the data is stored in the product originally. I figured that when the product is converted to BEAM-DIMAP, the chlorophyll .img is stored as unsigned 8 bit integers with 255 representing no-data values with the distribution that corresponds to the log scale:
I am not sure about the original .nc files, because I don’t know what format they have and how to inspect them. My question is: how are these values interpreted by SNAP as concentrations in normal scale? And is there a reason this interpretation is silent and comes up unexpectedly when exporting concentrations to other apps?
.nc denotes a NetCDF format file, but there are many versions in current use. NetCDF data sets often use the CF metadata conventions, which includes names and units for geophysical products. The current version (NetCDF4) is actually a simplified subset of HDF5. I use HDFview when I need to inspect a file in detail, but with most applications the details of scaling and missing data handling are handled automagically. If you are using macOS or linux and can install the NetCDF software you should have the ncdump program.
Matlab and R both support NetCDF and have tools to inspect metadata.
In the past I have used GeoTIFF format to pass data to GIS users, but it usually required many emails to sort out the metadata details, and extra work by the GIS users to properly import the data. Now that most current GIS packages support NetCDF4-CF it is much more straightforward to import data as .nc files in third party GIS packages, R, Matlab, etc.
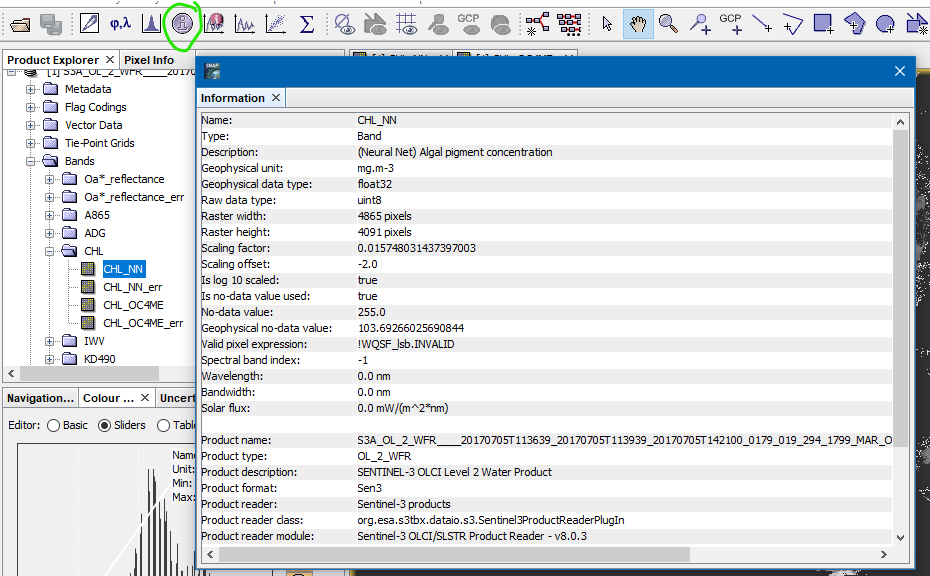
Besides that the data is log10 distributed, there needs also a offset and scaling factor to be applied.
In the information dialog you find thise values.
In the geoTiff only the raw values are stored. This was a decision made years ago, to save disk space. It turns out that this idea was not the best and is now difficult to change. But I think we will address that in the future.
If you would like too see the geophysical values in the geotiff file than create a copy of by using the Band Maths. In this new band all factors are applied. If you export this band the geotiff will have same values as shown in SNAP.