Dear EJFielding, sorry to bother you.
After your clarification, I took another Interferometric image with greater phase variation. I did the filtering and unwrapping process (figure attached). Apparently the unwrapping process has improved, however, I cannot analyze the unwrapped inteferogram visually. According to these images could you tell me which one better image? is there any metric to check which one better image?
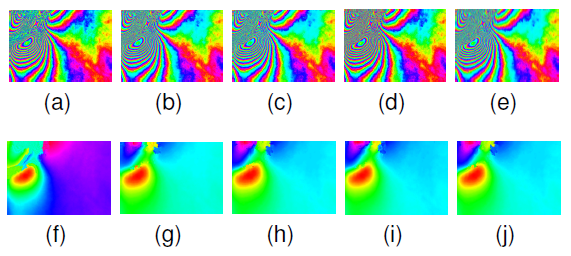
Figures 4a, 4b, 4c, 4d and 4e, we present the results after applying the filters Median, Refined Lee InSAR, LInSARRFE, TcNfilter and TcCfilter, respectively. On the other hand, in
Figures, 4f, 4g, 4h, 4i and 4j, we present the unwrapped phase.
Thank you once again.
Hello all
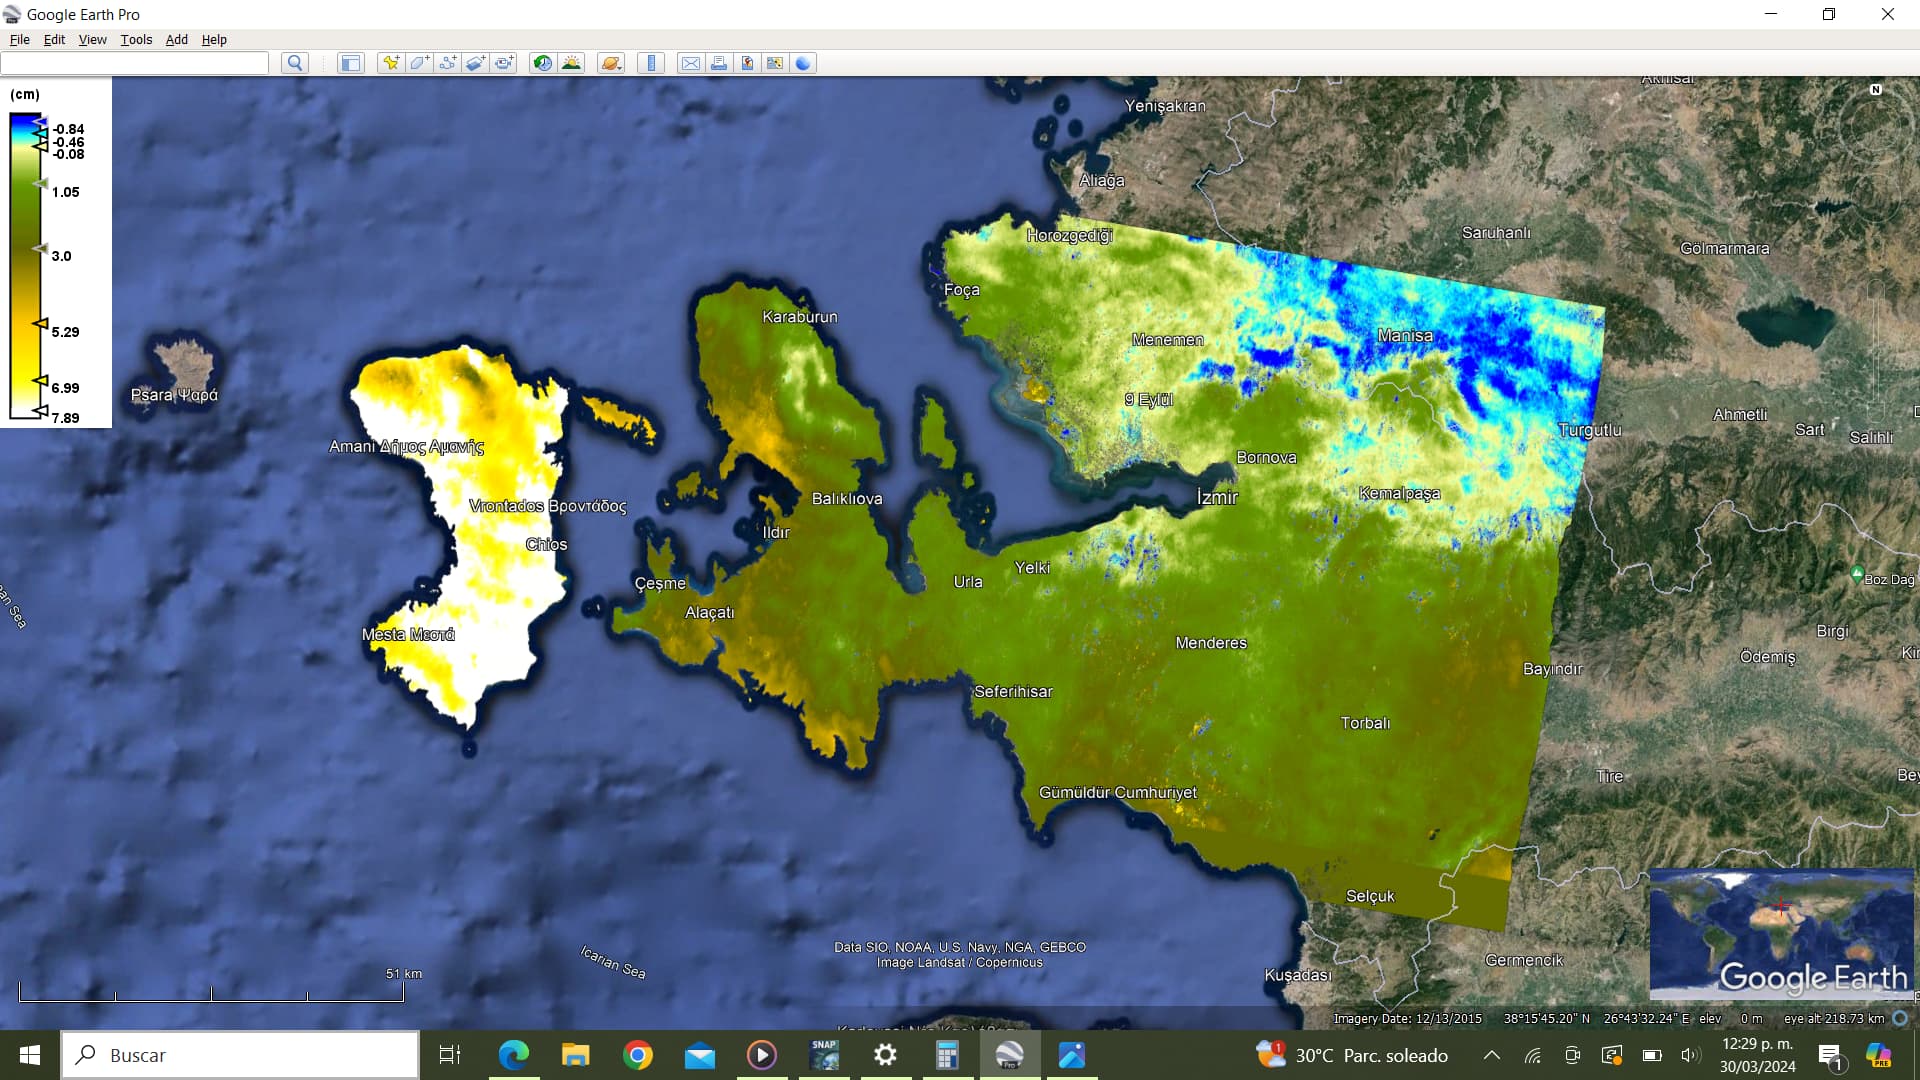
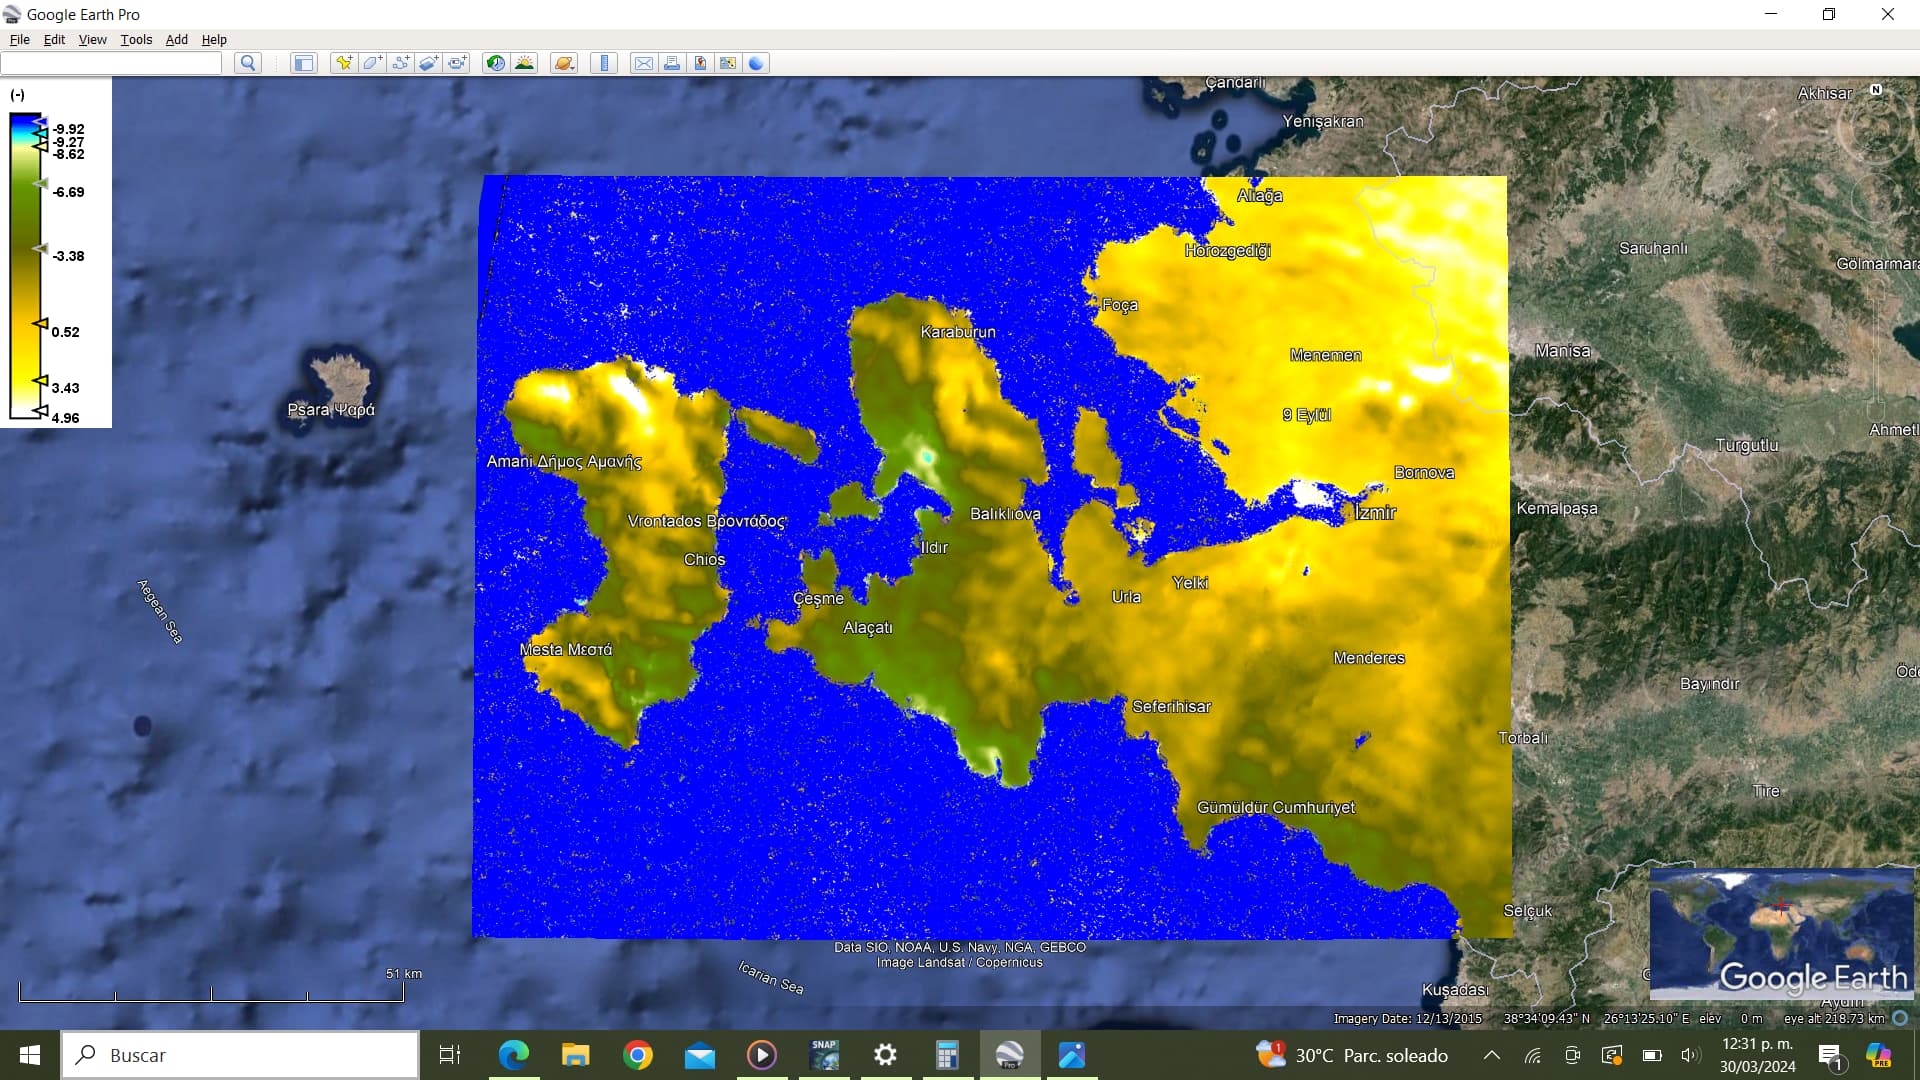
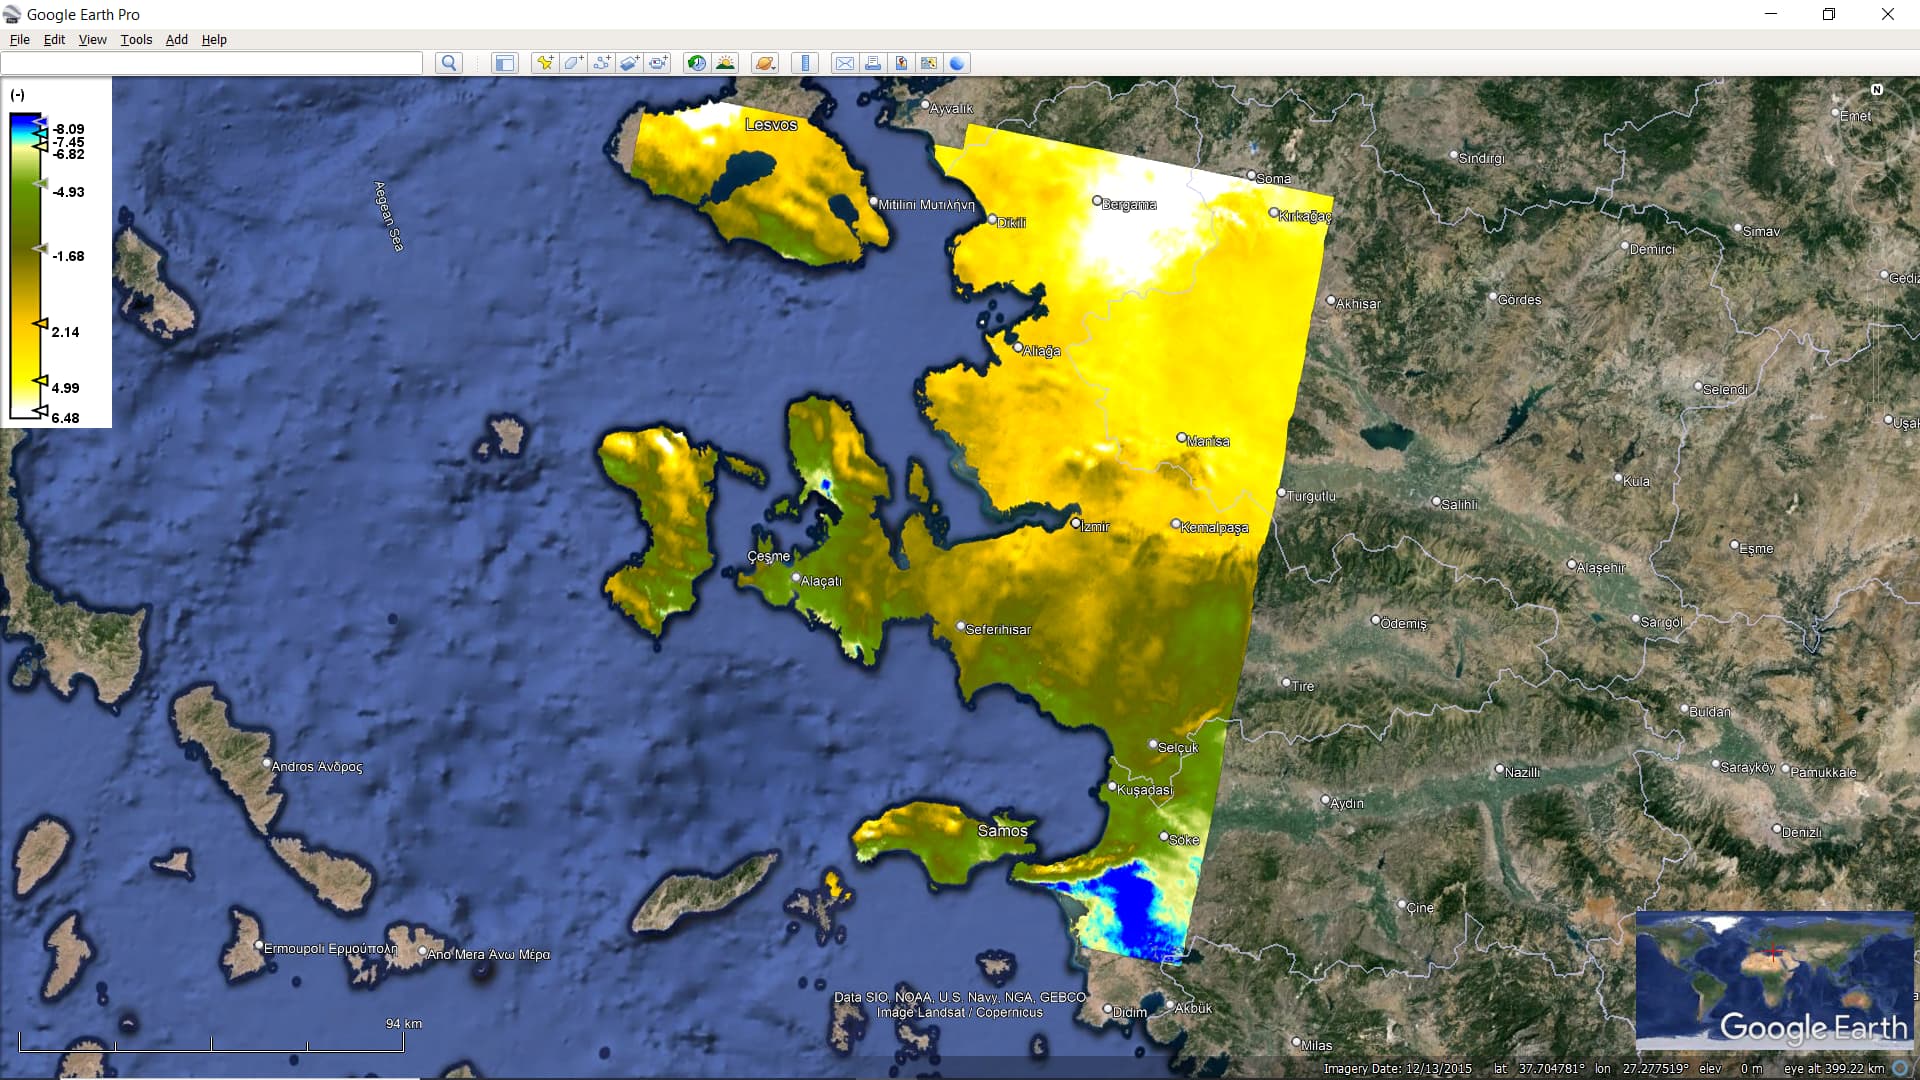
I did an unwrapping of a pair of SENTINEL 1 images with date 20180102_20180114 and obtained the following result, here you can see edge artifacts… I used SNAPHU, my values are in cm.
When I compared my result with a unwrapping with same images and date from COMET LICS, the values obtained are not consitent
The team COMET LICS said in its website the following about the unwrapping
-
geo.unw.tif: This is the unwrapped phase image in radian. The unwrapping is performed using SNAPHU. The zero values in the unwrapped file refers to the pixels which are masked out due to the low coherence.
If I convert the values from radian to cm, the values resulting are different. If the values are in cm, same are different. I am confused about this point. In both cases, the unwrapping did with SNAPHU.
Then, my question is, is my unwrapping incorrect?
1 Like
Hi all
I did the process again using ISCE 2 and the values obtained were more according with the results from COMET LICS to the same data and dates
Is there a tutorial where I can do this manually in SNAP? Just “Unwrapping”
Hi @mustafa4321
here  the link to the tutorial