Hi ,as the reference point is so important to PSI in ps_plot(‘v-do’, ‘ts’) step,But it is difficult (almost can’t )pick an ideal point from the colored picture,It must be very helpful can anyone share the experience help me to do this
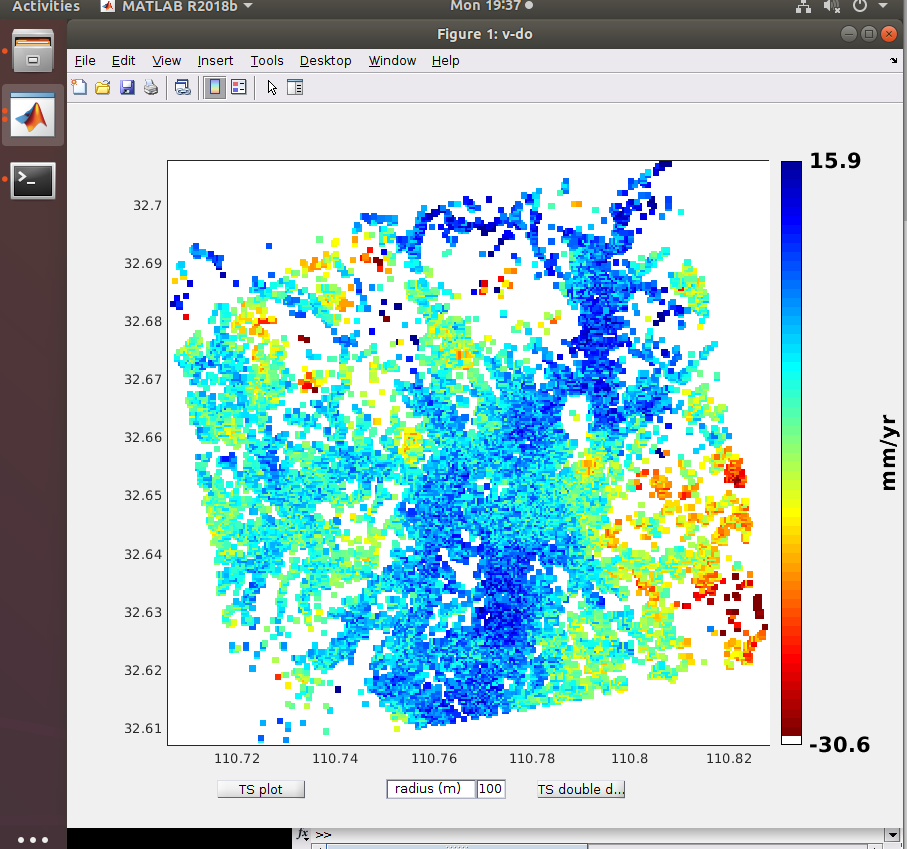
actually, the reference point is not important for ps_plot('v-do, ‘ts’), because with this command you simply draw a temporal profile of the relative displacement over time. What you select with your mouse cursor in this command is the area where you want to get this temporal plot:
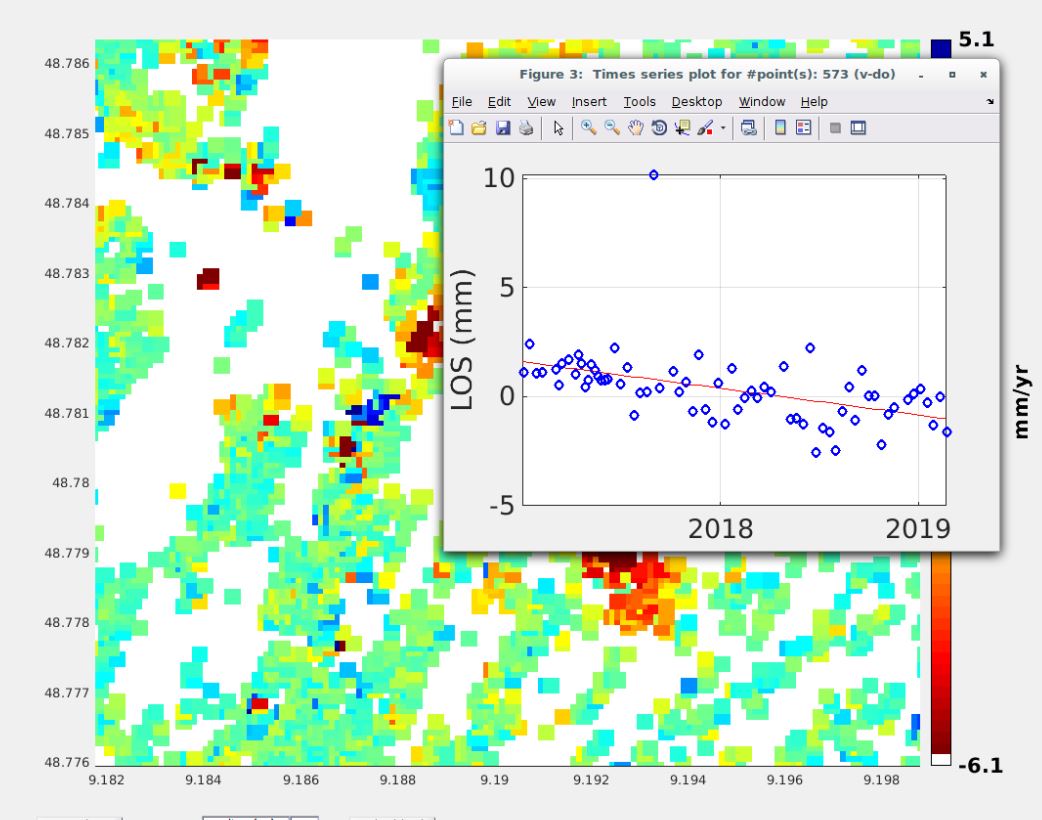
The variation along this profile (determined by the nuber of images) determines the stability and reliability of your results. In my example, there is a general trend, but it has some variation along this trend which should not be trusted too much (rather caused by inaccuracies), and one additional - and obviously wrong - outlier.
What you define with
- ref_lon and ref_lat (for a rectangular area) or
- ref_centre_lonlat and ref_radius (for a circular area).
is an area which normalizes the overall scale of your plots (color coding) so that areas of zero change are displayed as zero. This point can only be selected based on local expertise. Areas which are unlikely to have changed during this time. But this is not easy to determine. If you don’t define any if these parameters the image average is taken as reference
2 Likes
I think I can catch your main idea about the ref points which confusing me a long time,many thanks for your guiding!!!