bumky
1
Hello sir,
I was looking for the function that indicating concentration scale bar on the map.
which means, when I open any parameter there are concentration range in the color manipulation tab.
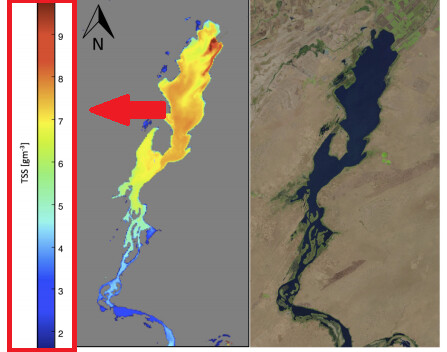
and I need put this colored bar on the map like picture below.
I figured out how to insert the length scale bar but need concentration bar.
I’ll appreciate when I get how to solve this matter.
Thank you.
ABraun
2
Have you tried File > Export > Other > Color Legend as Image
bumky
3
oh I really appreciate about your comment.
I could get this chart
GK2B_GOCI2_L2_20210419_041530_LA_S007_TSS_legend.bmp (140.1 KB)
I was wondering isn’t it possible to insert this bar inside of the SNAP map
or should I manually synthesize those things?
Thank you very much.
marpet
4
Unfortunately it is not possible to directly overlay the color bar on the image.
But you can import it afterwards as an image via the Layer Manager.
But it might be easier to do it in a step afterwards I a GIS application or imaging software.
Creating such maps it not a strength of SNAP.
1 Like
bumky
5
Thank you very much sir.
the detailed explanation was really helpful both of you.


