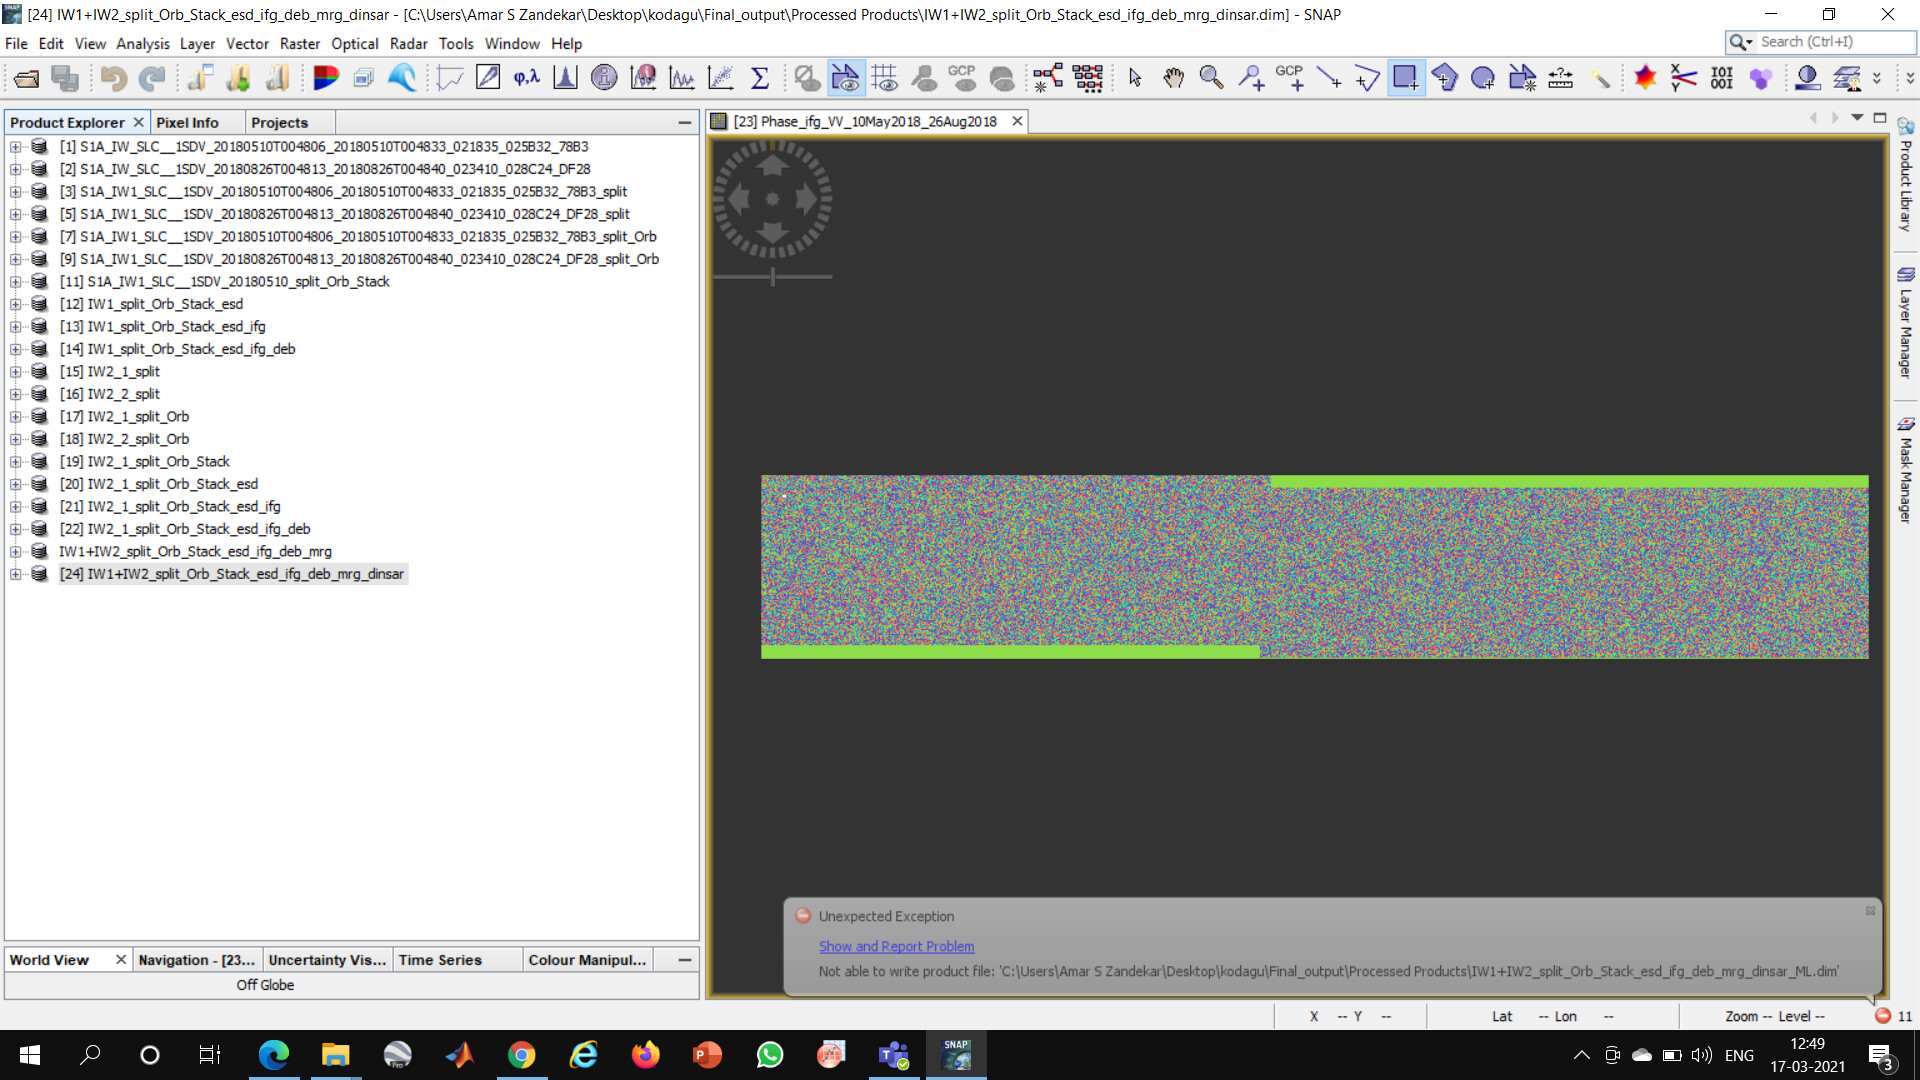
I want to calculate displacement for the Area of interest which comes between IW1 and IW2 I tried to do merge after Split_Orb_Stack_esd_ifg_deb_mrg_dinsar
but after this when I tried Multlook I am getting error how to solve this problem
I want to calculate displacement for the Area of interest which comes between IW1 and IW2 I tried to do merge after Split_Orb_Stack_esd_ifg_deb_mrg_dinsar
but after this when I tried Multlook I am getting error how to solve this problem
Could it be that the disk space is not sufficient?
Please try without the + sign in the file name, maybe this causes problems.
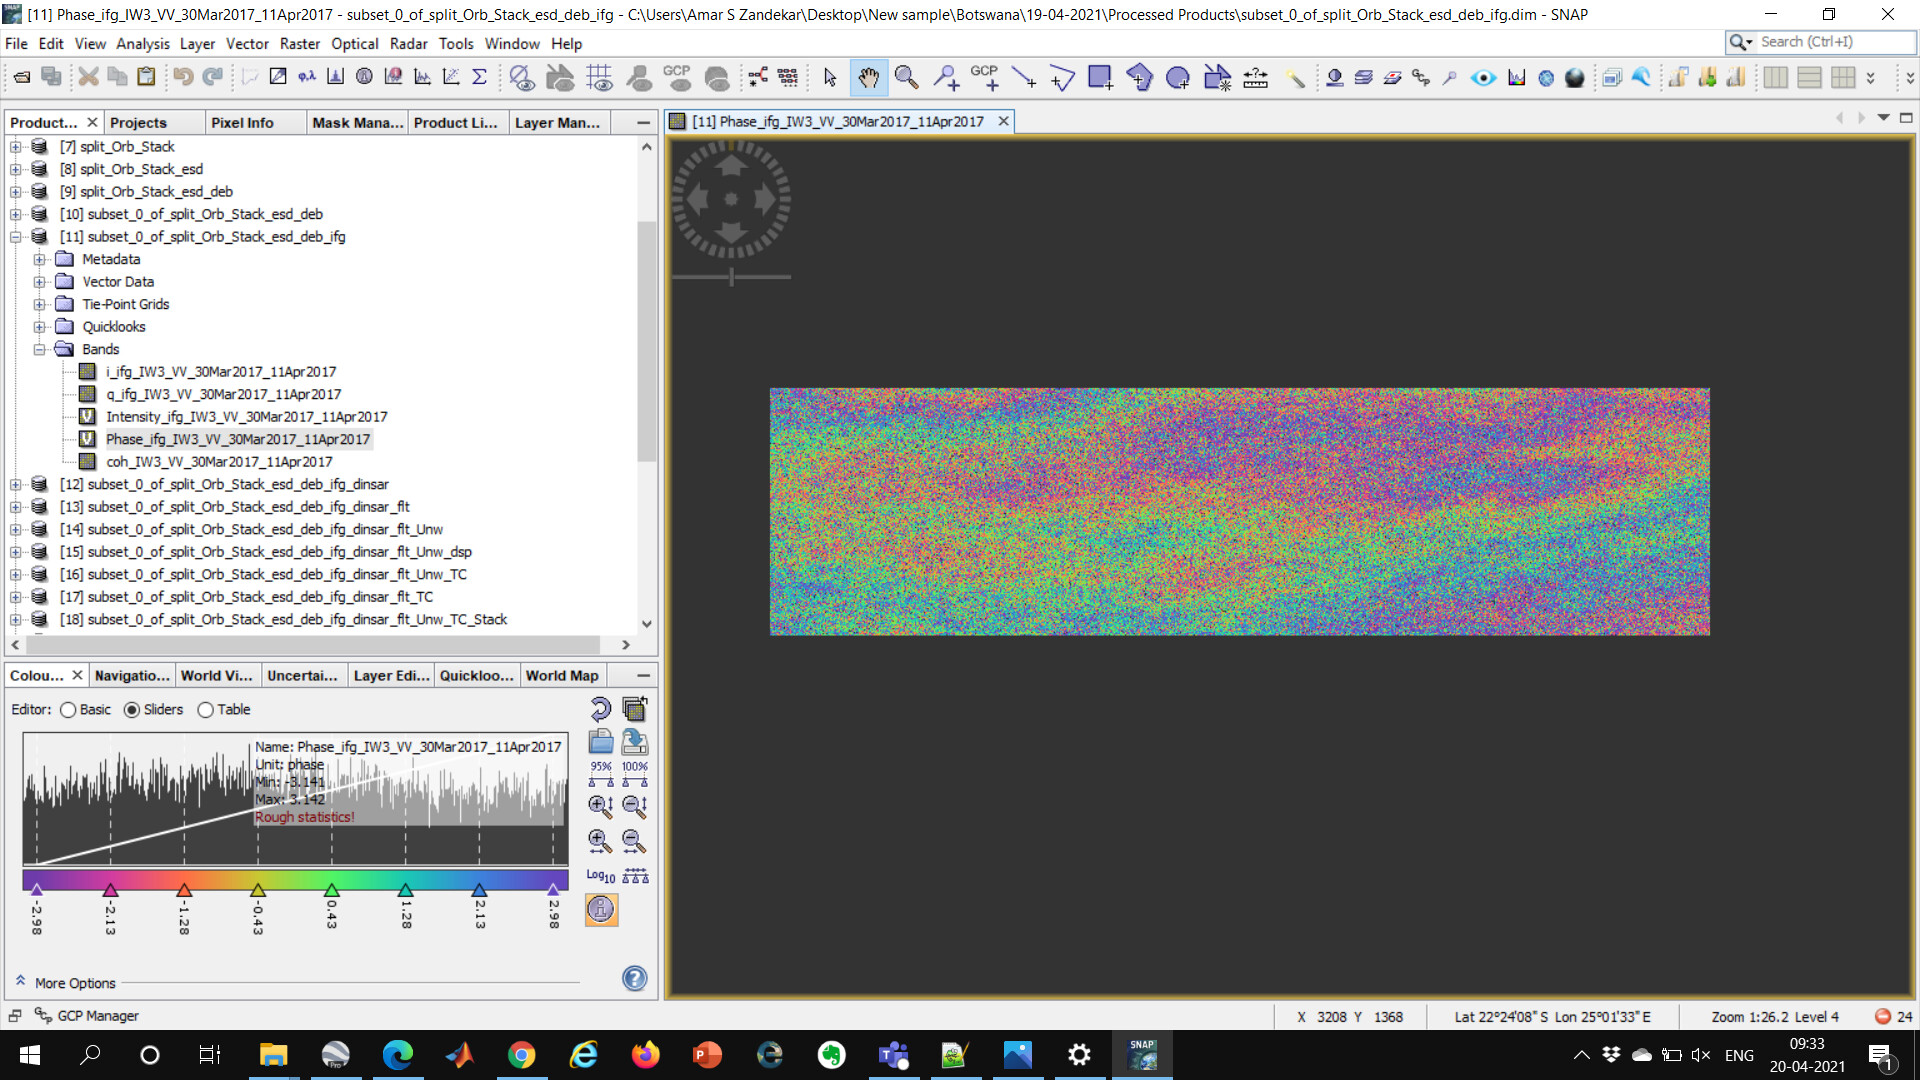
Besides that, the quality of your interferogram is quite bad, probably because of temporal decorrelation. Please don’t expect too much from the result.
Sir how could I reduce the degree of temporal decorrelation
By picking an image-pair with the shortest possible time between acquisitions.
Maybe also this FAQ entry helps you: I have performed an InSAR analysis, but the result is not correct
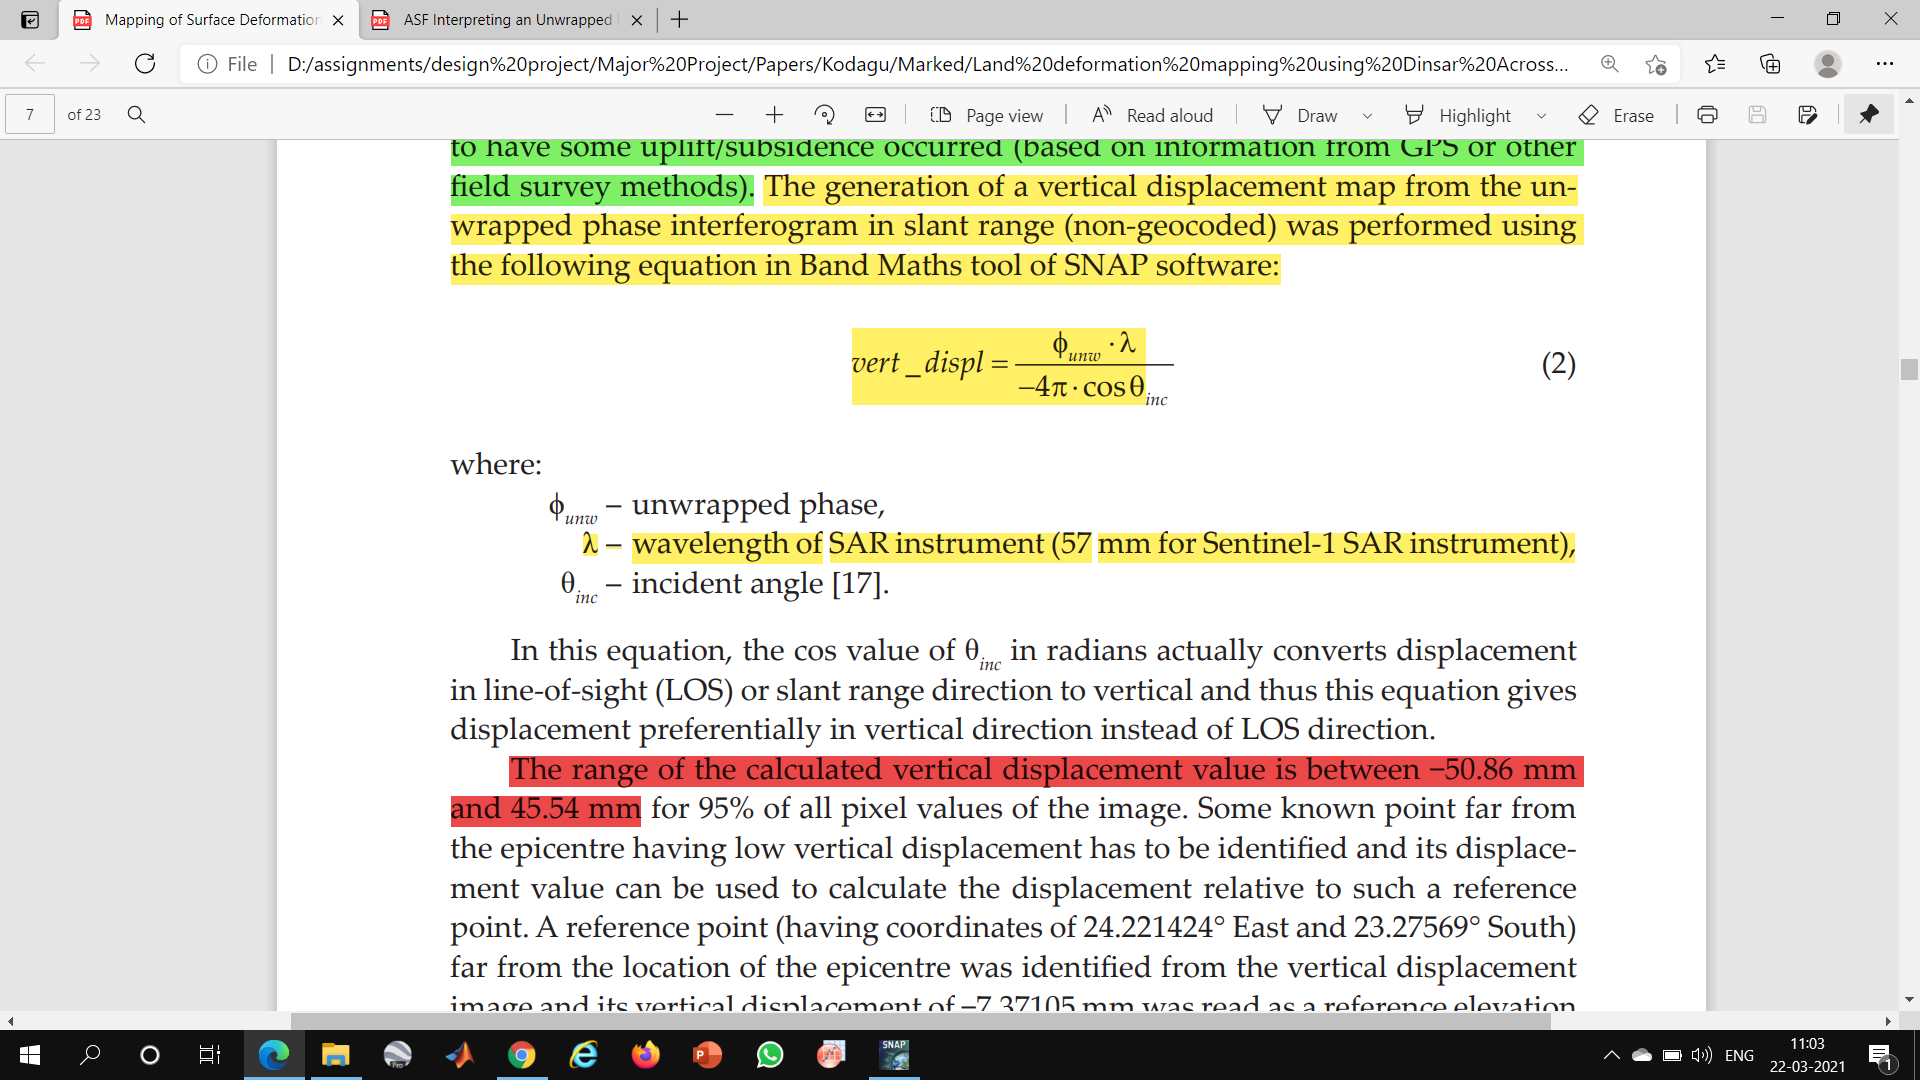
sir for trial and error i have selected a published paper and used same area of interest,Sentinel-1 data used by the author of the paper and
iam getting vertical displacement values ranging from -84.139 to 104.147 mm
But the author got -50.86 to 45.54 mm
can u please help me is how iam getting this much error
the extreme values are not representative. Most of your data ranges between -40 and +50 as you see in the histogram in the color manipulation tab.
Please have a look at this FAQ entry: I calculated displacement with DInSAR, but the resulting range of values is unrealistic
Thank you sir
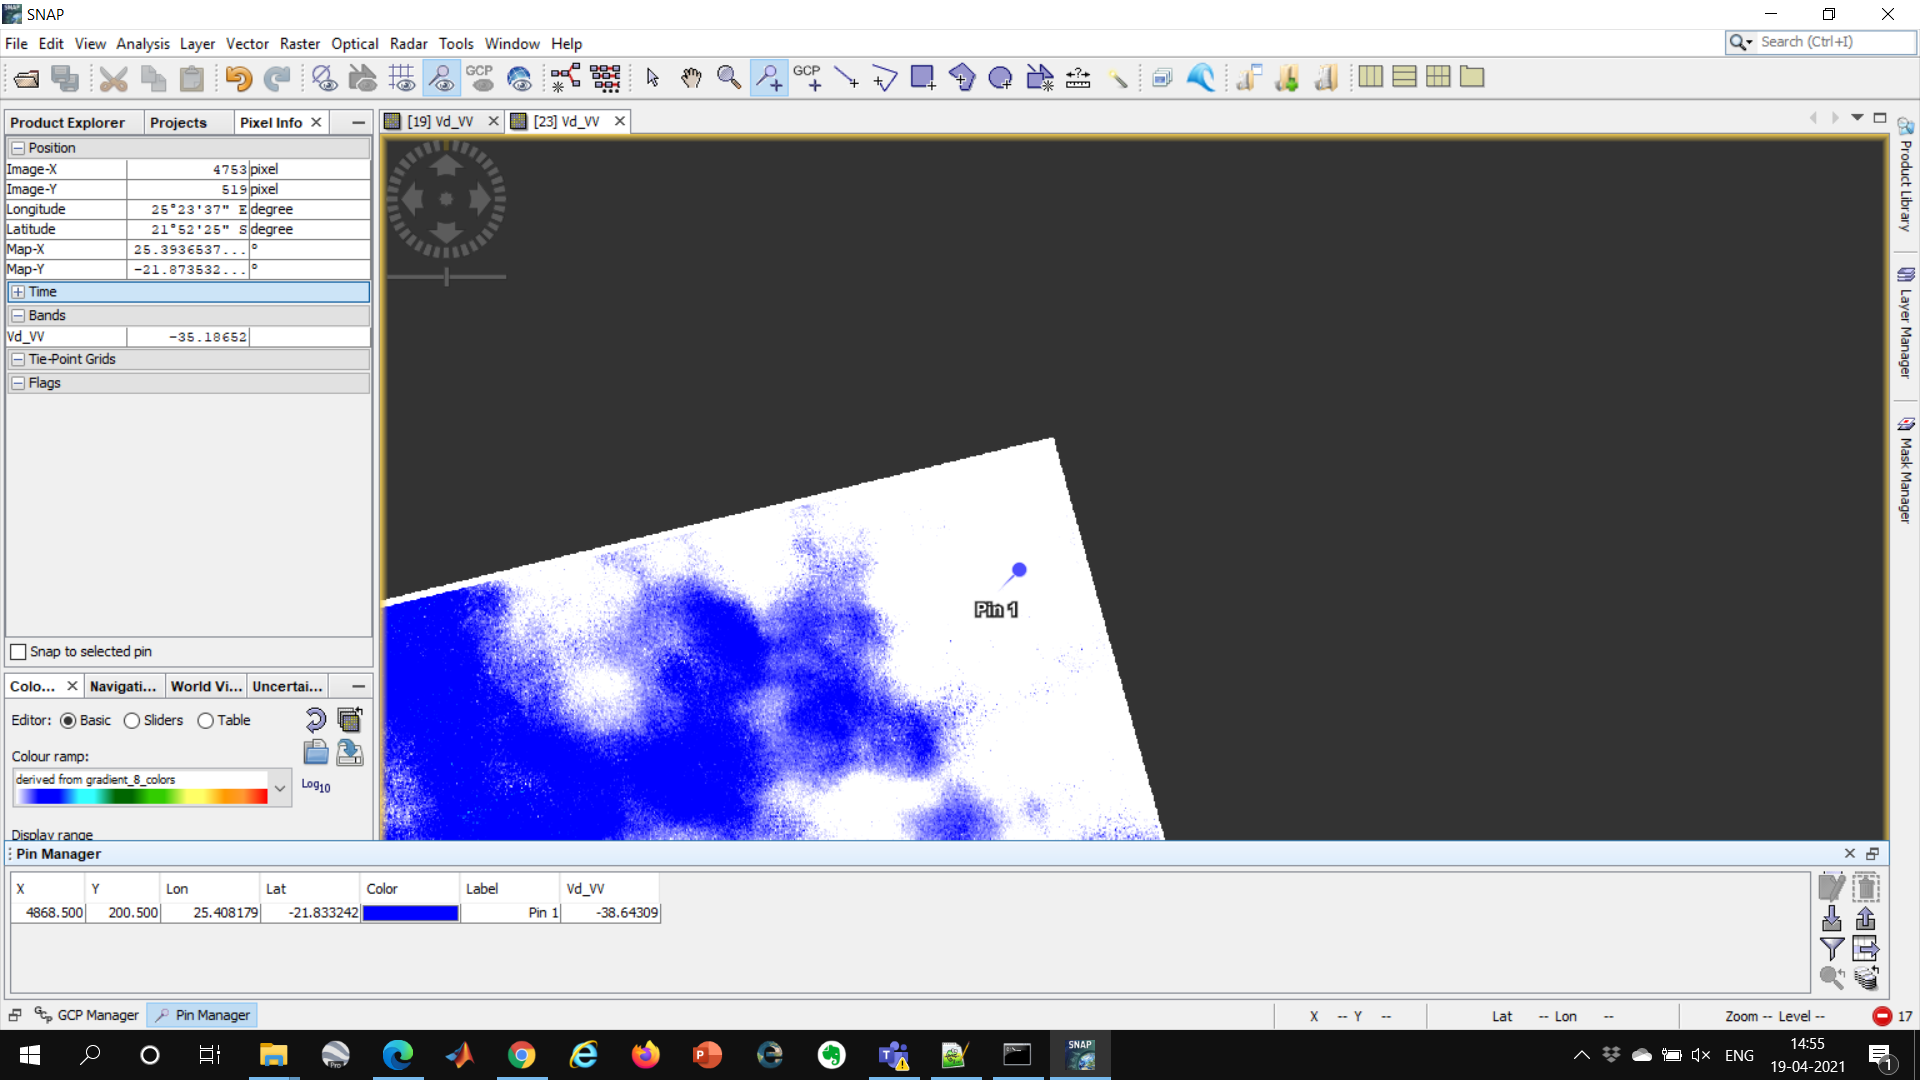
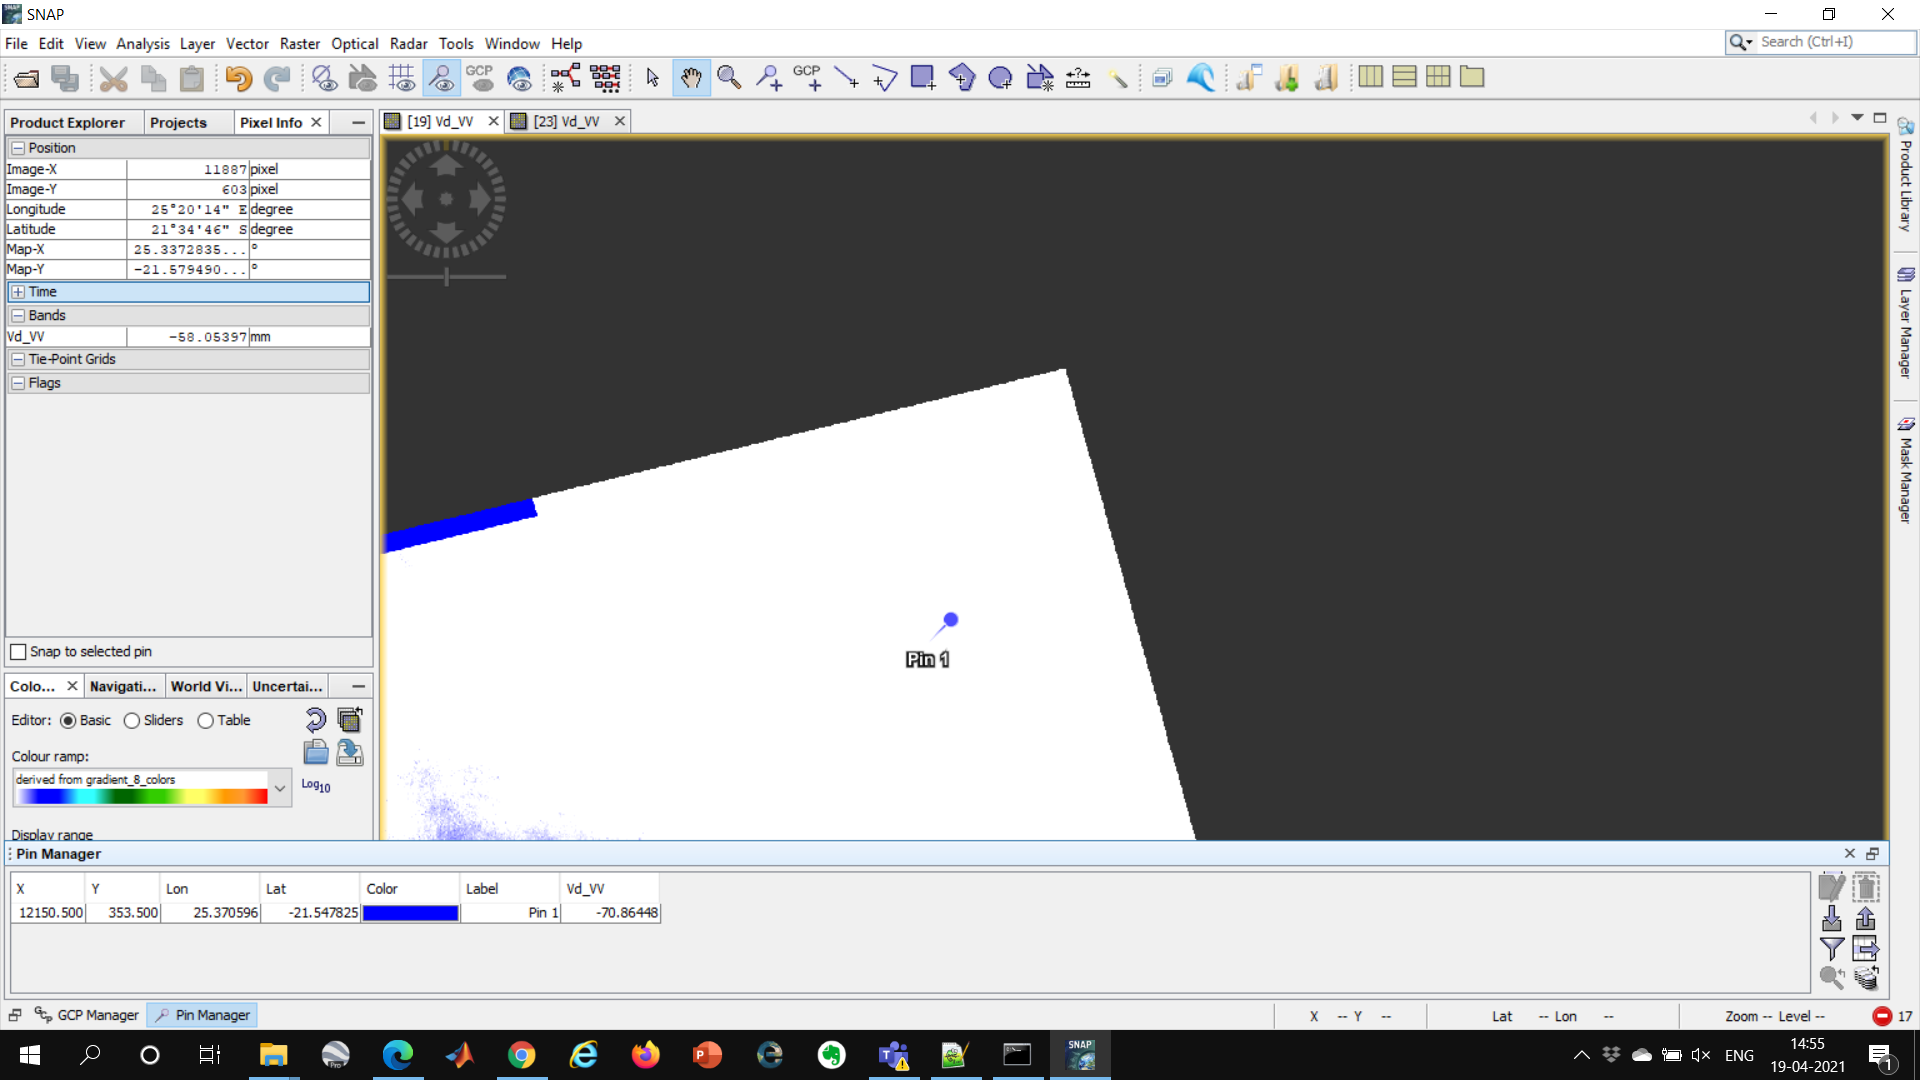
Can anyone please explain to me how to choose a reference point of no deformation in the above-attached images of my area of interest
Sir For the above area of botswana i have calculated deformation by using the following procedure
S1 TOPS coregistration with ESD
2. Deburst and Subset
3. Interferogram Formation
4. Topographic Phase Removal
5. Goldstein Phase Filtering
6. Snaphu Export
7. Unwrap via Snaphu
8. Snaphu import
9. Phase to Displacement
10. Range - Doppler Terrain Correction
First for total tile than for a small subset of area of interest
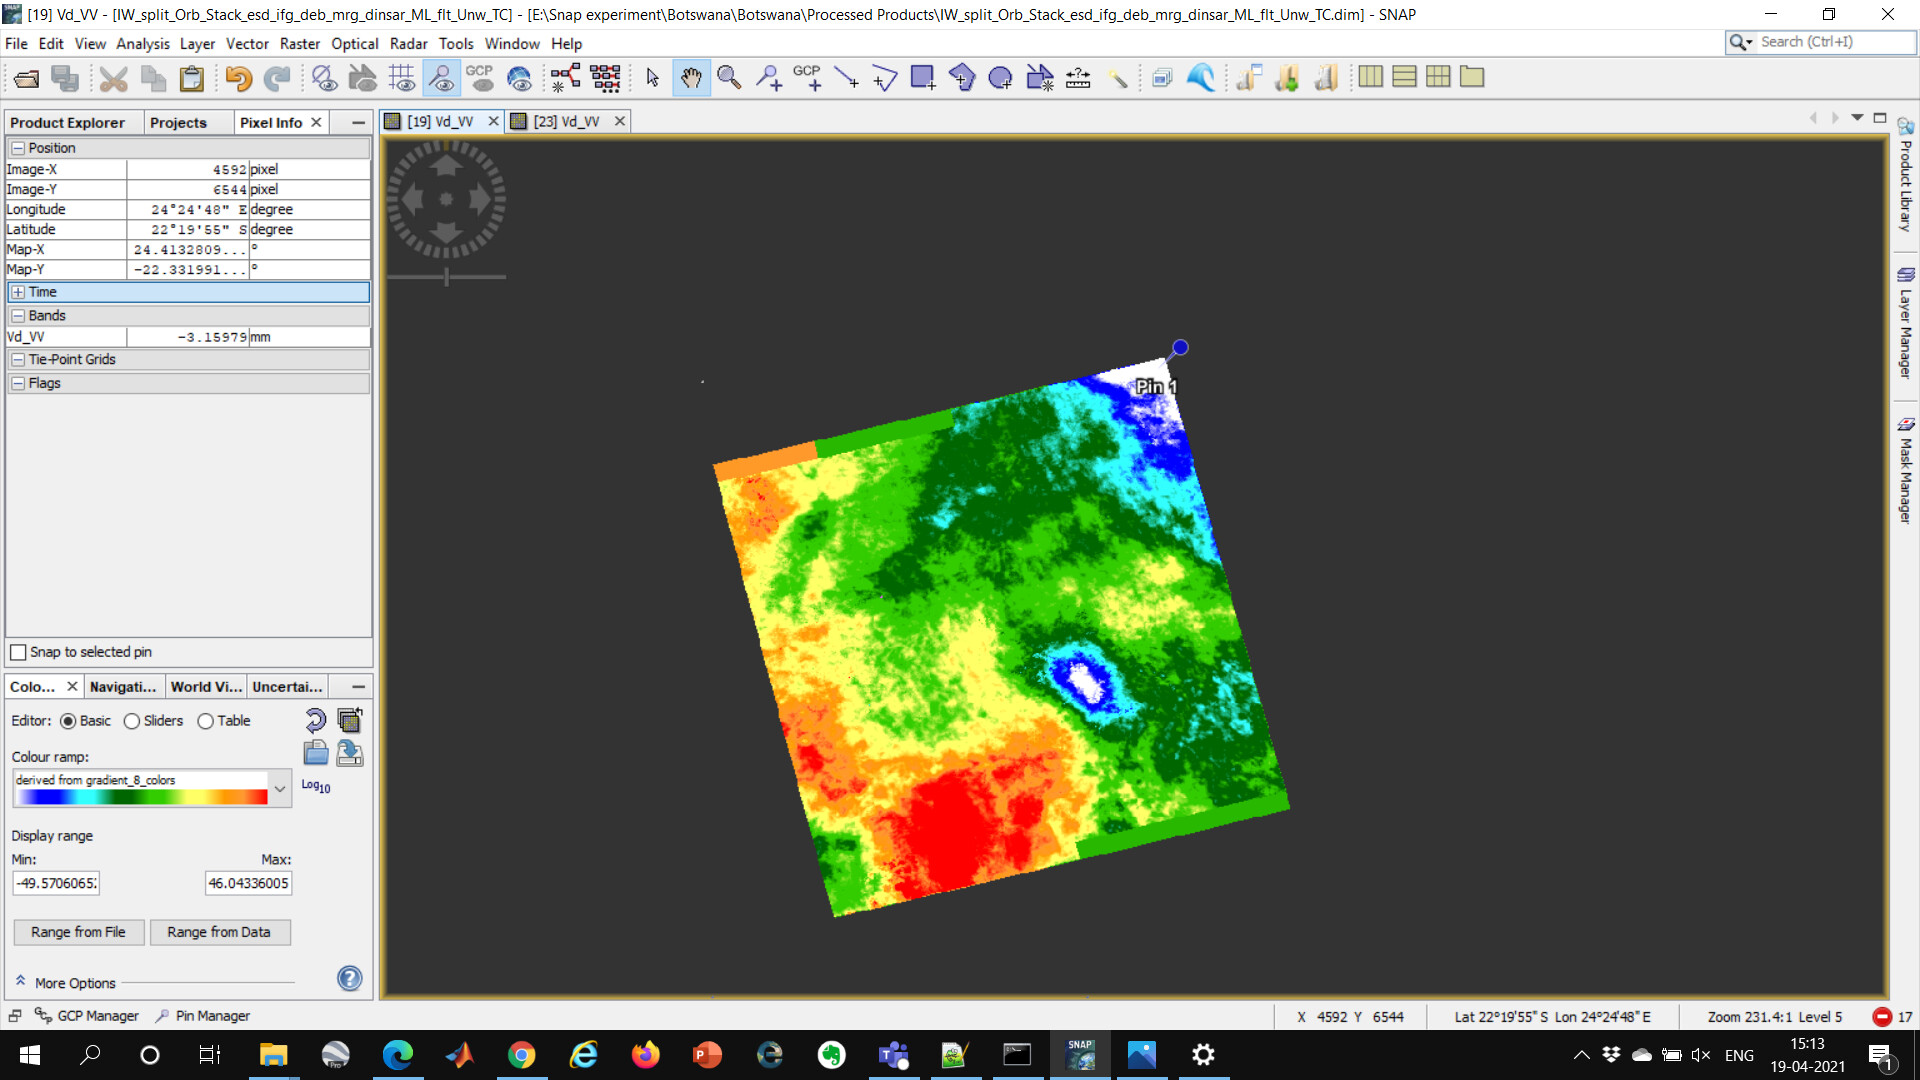
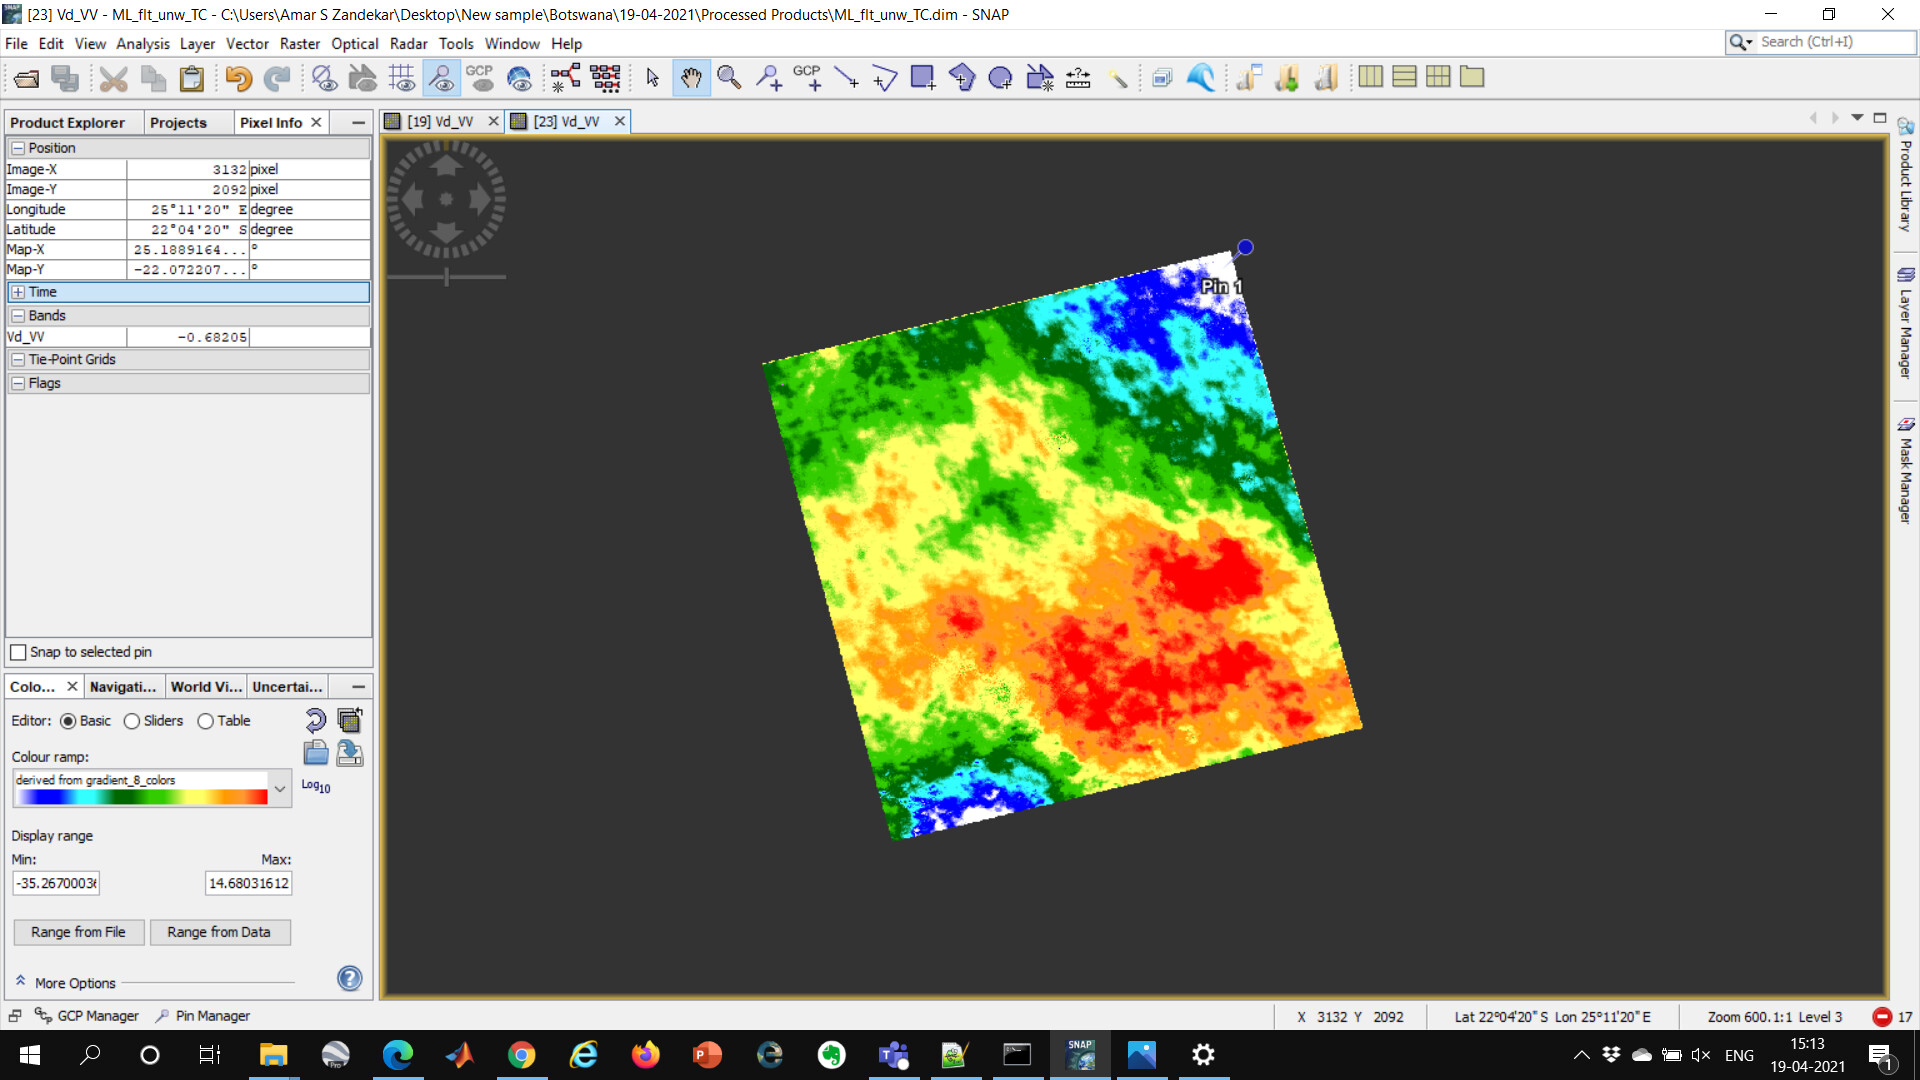
for particular coordinates, I am getting different displacement for subset and different for whole area
attached pictures
Figure: 1 is subset and
Figure : 2 Total area
please help me sir
I think it is not ideal that the reference point you selected is at the edge of your data. Depending on your interferogram (can you please share a screenshot) and the size of the subset, the unwrapping can produce different results.
Based on the displacement pattern which looks quite influenced by atmospheric errors, it is not surprising that the pixels (different coordinates in your screenshot) have different values.
Also, the color palette ranges between different min/max values in your examples.
Did you see this?
Do these patterns make sense to you with respect to surface displacement? Do the same patterns occur with different image pairs? If not, the observed pattern is likely to be influenced by atmospheric phrase contributions.
The lower the interferogram quality the higher is the risk that unwrapping produces random results which differ each time you execute it.
InSAR is a sensitive process with lots of error sources, especially unwrapping is an iterative task which starts at random locations, also the tiling is different when you make a subset. All these things are potential reasons why the results differ.
If you want precise results, try to have the area of interest more in the center of your data, use multiple image pairs with short temporal baselines and minimized rain occurrence.
One way to average results of multiple images is given at the end of this tutorial: Sentinel-1 TOPS interferometry
Thank you for your reply sir
I am a Research student pursuing an MTech at the National Institute Of Technology India
One doubt sir, Did you do any validation of your work with respect to land subsidence if yes means please share your work(such as Thesis, project PPT, etc) via my mail id
amarszandekar.192rs002@nitk.edu.in
validation is only possible by field measurements (GNSS or levelling data) or by test for plausibility via field surveys (e.g. check for cracks in buildings or roads in areas of large subsidenece).