Hi everyone:)
I have two ALOS-2 level 1.1 SLCs in CEOS data format. They are in Stripmap-mode and have a temporal baseline of around 2 months. Additionally, I have a “ground truth” lidar data height GeoTiff. I wanted to plot the coherence vs. the lidar height in some sort of a scatterplot. Hence I thought the lidar-data and the coherence-estiamte shoulb be “coregistered” and resampled.
I formed the interferogram according to this procedure:
I need to confess that I didn’t look too much into the processing parameters in that workflow. Now my final result has due to filtering and multilooking some resolution that is completely different from my 10m resolution Lidar height.
Does it make any sense to resample the coherence again to the lidar height or do you think it would be better to resample the lidar height to the coherence estimates?
Any help would be super appreciated:)
Thanks a lot and yes of course, I’m sorry for this unclear question…
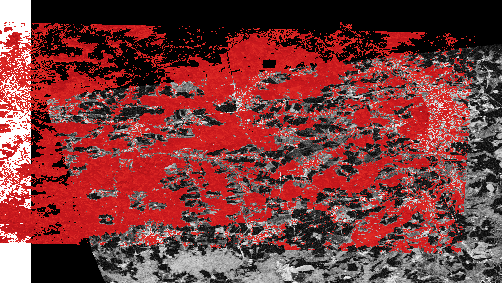
So I have the lidar height (in red) and the coherence. It’s just that I don’t know what the best way would be to make a scatterplot of the two rasters for each “pixel”. Or if this is a good idea at all. I’m interested in the relation between those two variables and thought it might be a good thing to do, but now I don’t know how to proceed.
Also when I do a gdalinfo on my coherence that I exported as a tiff I get:
Warning 1: TIFFReadDirectory:Sum of Photometric type-related color channels and ExtraSamples doesn't match SamplesPerPixel. Defining non-color channels as ExtraSamples.
I don’t know if this is a problem. But maybe I should consider some essential steps when forming the interferogram and estimating the coherence in order to do something like this afterwards. And it’s these steps that I’m a little insecure.
if you want to create a scatter plot of both coherence and lidars you have to geocode the coherene using (Range Doppler terrain correction) and select the projection of the LIDAR data as output coordinate system.
Then you can import the lidar data and use the Collocation tool to bring both into one product.
thanks a lot!! Do I need to pay special attention to the parameters when forming the interferogram (and as a side product in snap the coherence)? Because it seems kind of wrong to make a scatterplot of two rasters that are in the same projection, but have a totally different resolution.
You can even calculate the coherence in a separate module (without the interferogram).
The window size of coherence can play a large role so it is good to calclate different versions and compare.
About the scale of both datasets: I see little options to avoid that because LIDAR is of much higher resolution. In the Collocation module you can define a master product (probable you select the SAR data here) and the slave (LIDAR) is resampled (at best bi-linear) to its resolution, so averages will calculated per SAR pixel.
Up-sampling the radar data to the LIDAR resolution does not make much sense to me as well.