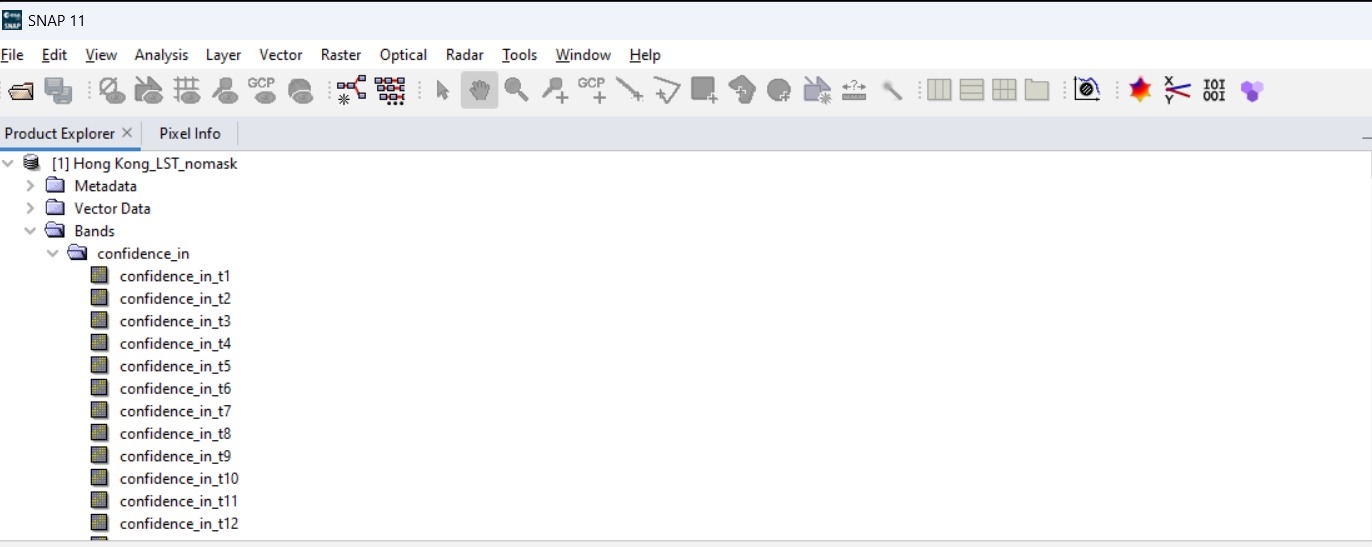
I have downloaded SLSTR Level 2 LST data in a .nc format file using Openeo python client library. The data is mostly for cities based on my preference of area of interest and period. After downloading the data and applying cloud masking using the openeo mask to mask out pixels above a certain threshold. But this leads to some cities ending up with negative temperatures even during summers which I know is not possible. I have been told that it’s more advisable to use SNAP tool to mask out clouds. I have SNAP desktop installed on my PC and trying to apply mask but I am not sure how to apply using the available tools within SNAP. Are there tools that can apply cloud mask on SLSTR data? Here’s the screenshot of what bands I see in the data.
1 Like
Most tools in SNAP need the original data as input. In your case the data in SAFE format. However, there is no dedicated clod detection for SLSTR as far as I know.
But the SLSTR LST data already provides a cloud mask, actually multiple.
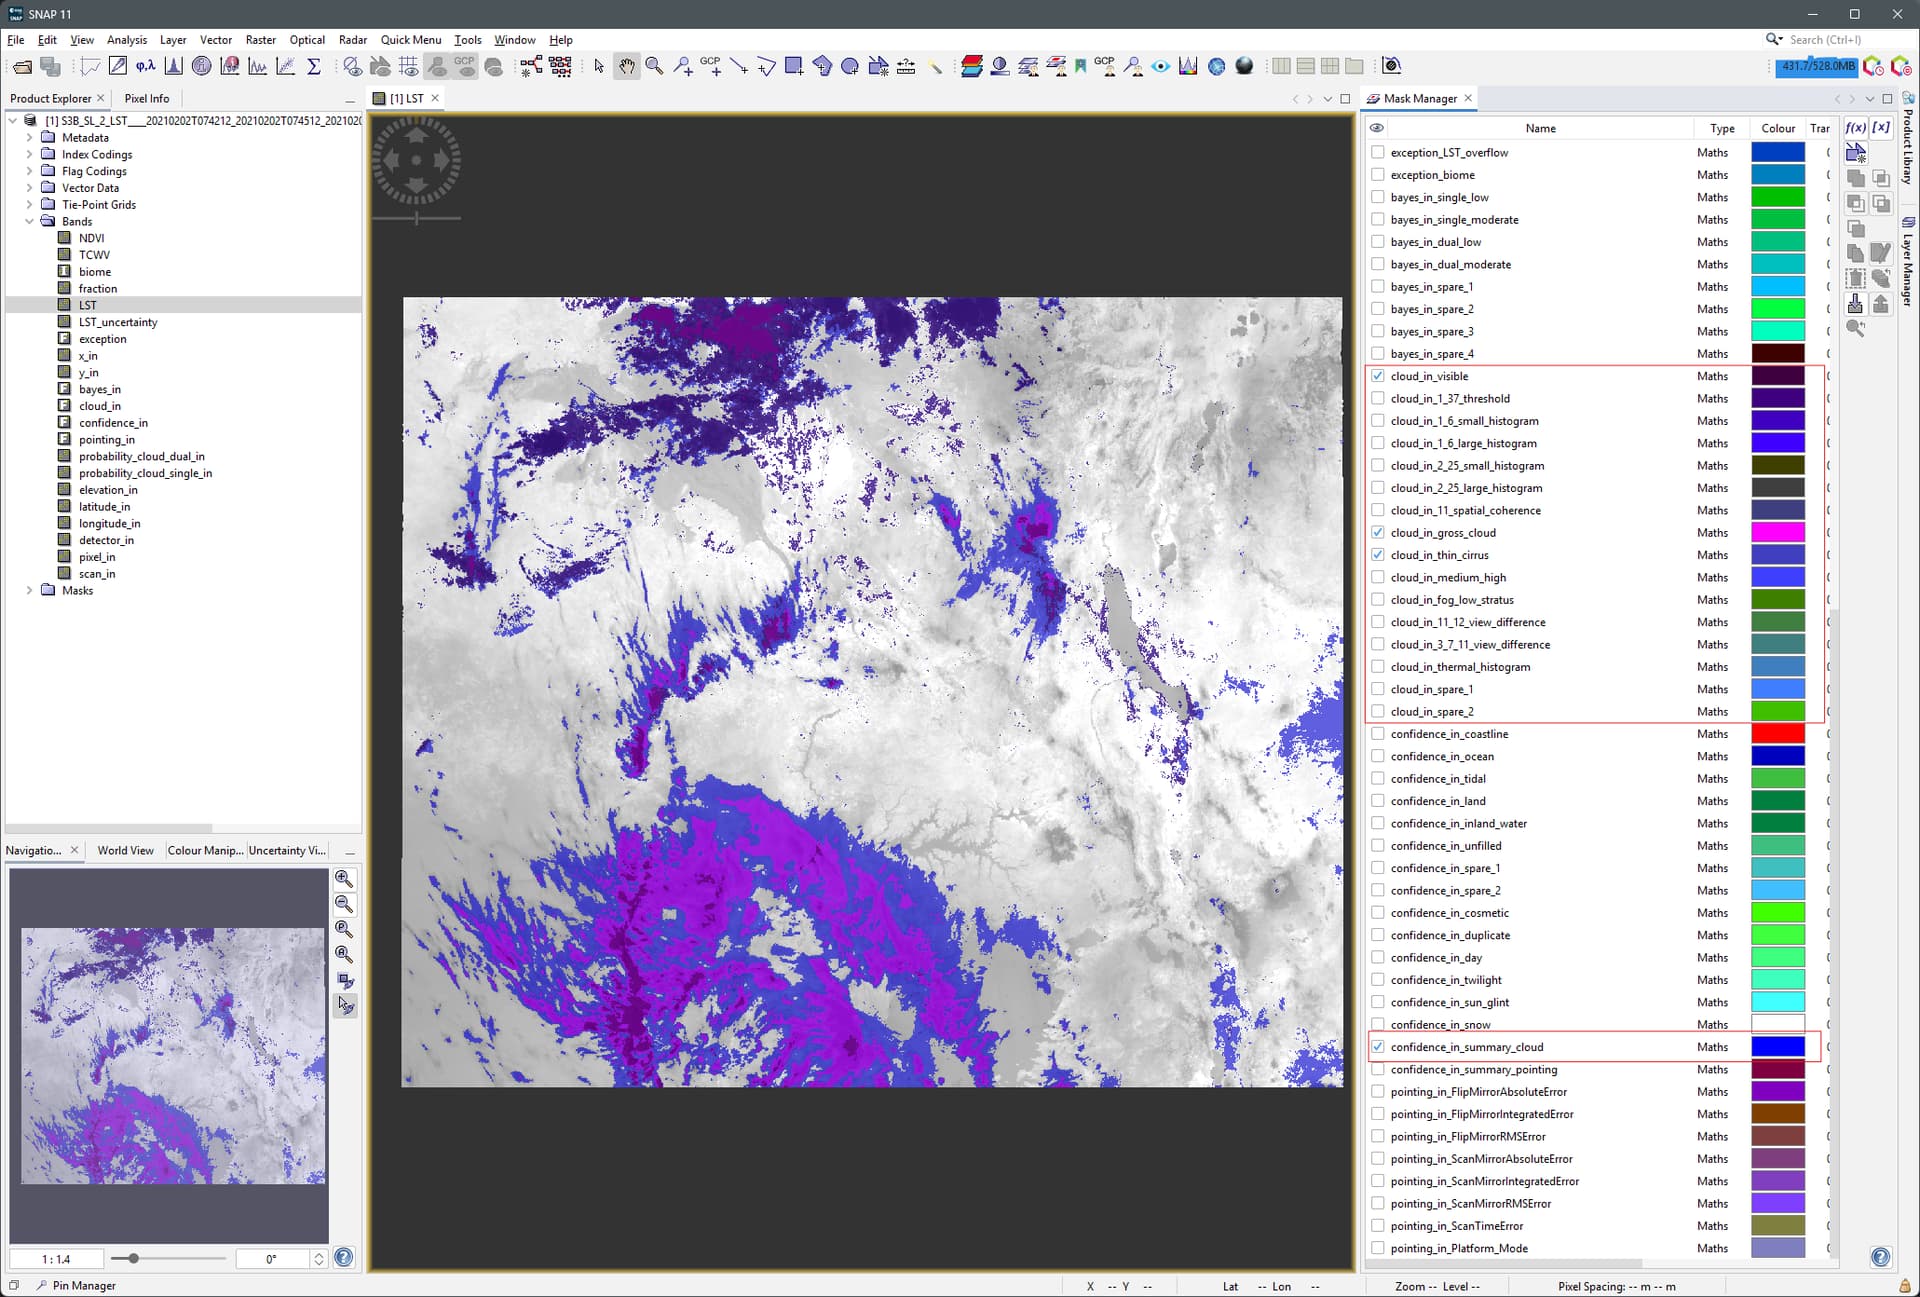
Maybe this is a possible option for you.
![]() Marco from EOMasters - Mastering Earth Observation
Marco from EOMasters - Mastering Earth Observation
1 Like
Thanks for the possible solution ![]()
But I need to define my area of interest explicitly for visualization. For example, for the city of Hong Kong, I am defining my area of interest(lat,lon) as
{‘west’: 113.91249380863059,
‘south’: 22.19515215480741,
‘east’: 114.283119815359,
‘north’: 22.54013271582164}
And then I download the LST band data.
If I try to use original data, then I have to define a specific product and download it. That would defeat my requirement because I want to filter data based on area of interest only. And then another challenge would be to automate this.
So now the questions are
- Can I download data based on area of interest in the original format itself using a Python client.
- Can i apply these masks that you have shown here using the Python client
Any help is appreciated.
The reason why I have this Post is because I am getting negative Land Surface Temperatures for some cities including Hong Kong during summer times and that’s most likely because of dense cloud cover leading to erroneous readings.
You could download data based on the area, but you would have to subset the data afterwards and maybe mosaic the scenes if your area spans across multiple scenes.
But I assume that you can include the cloud masks in your data by using openEO. This might depend on the backend you are using.
session = openeo.connect("...")
session.describe_collection("collection_id")
This should provide you the information what the collection provides. It should contain the masks.
I haven’t used openEO before, so my assumptions might be wrong.