Hello guys,
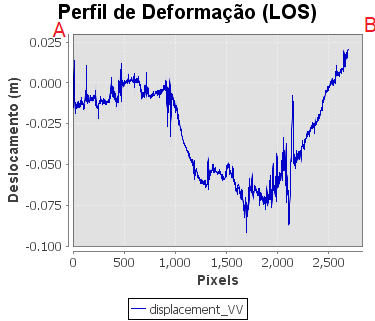
I’m new on interferometry processing, so I’m wondering what can I say about the displacement of this image? What about the profile plot?
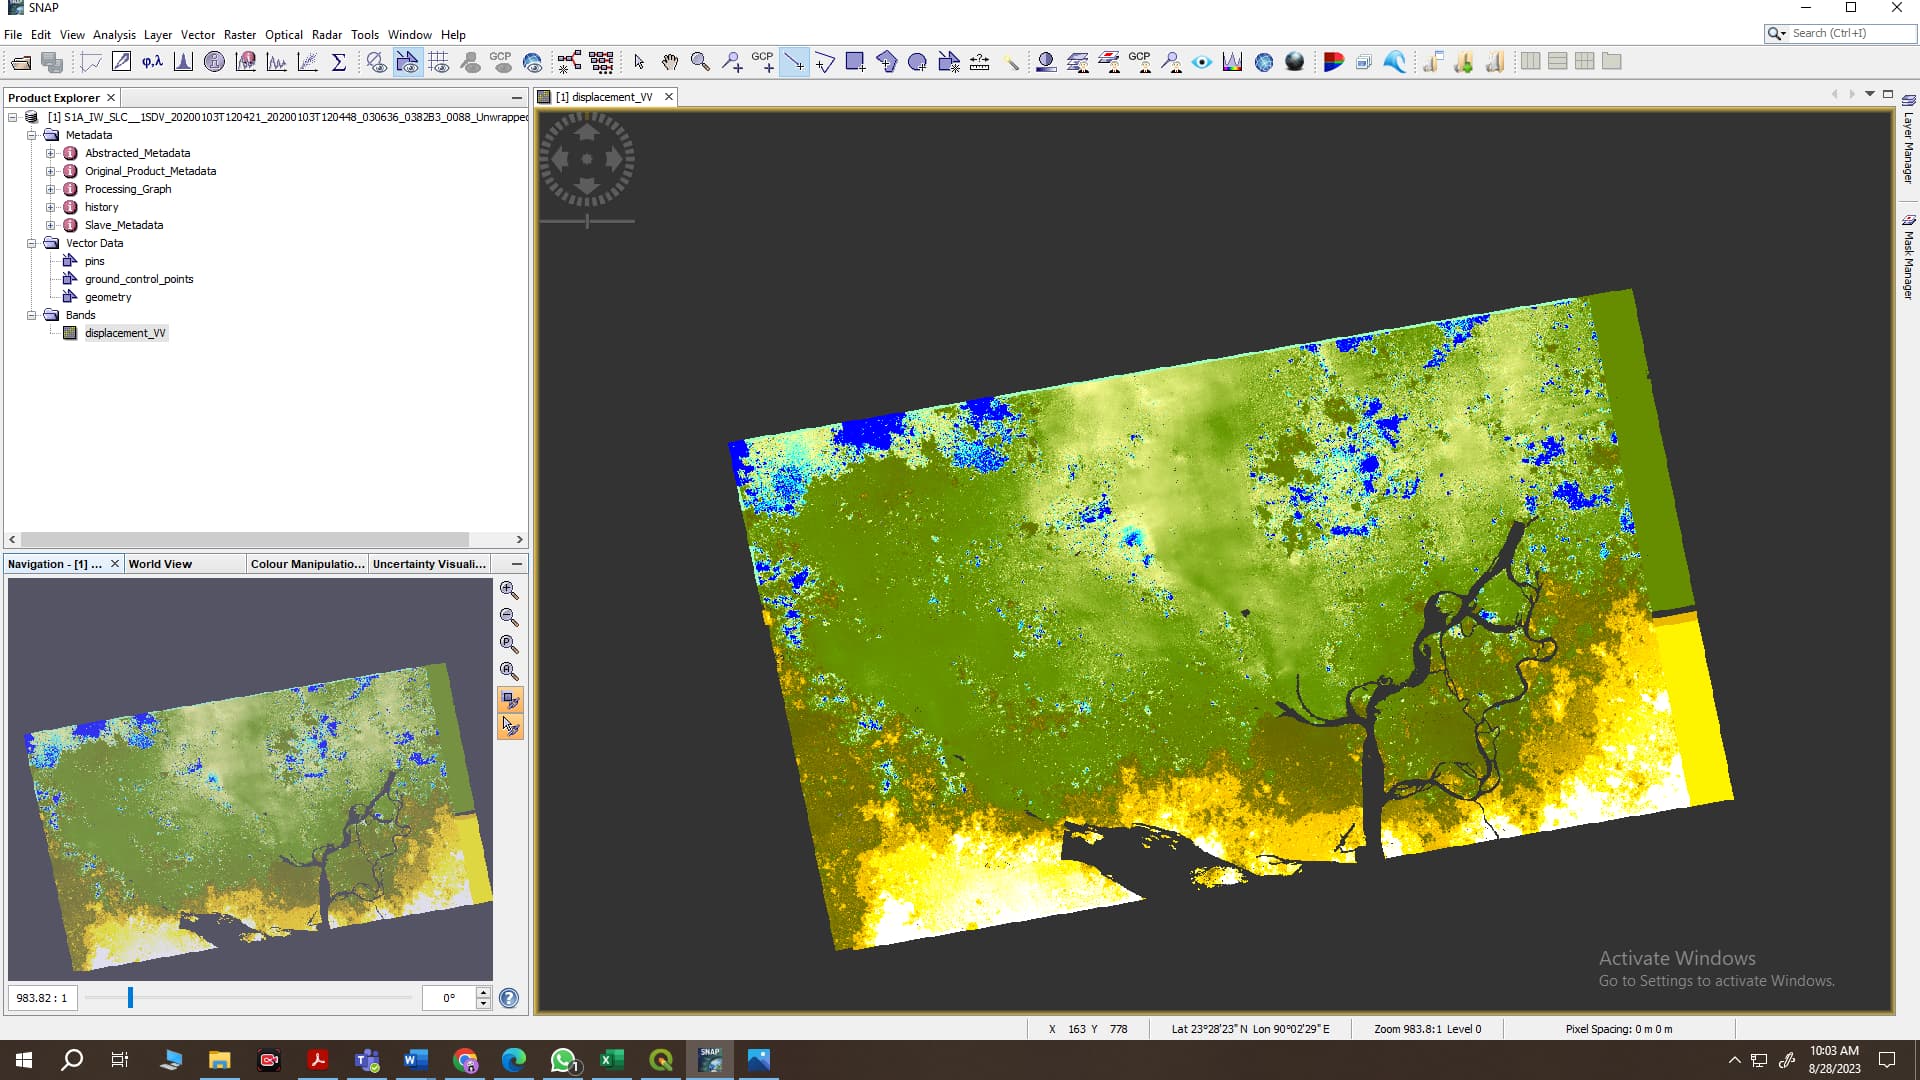
This is a displacement map of Napa Valley area, generated with 2 SLC images from 07th august and 31th august, 2014.
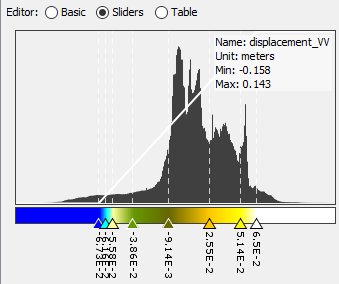
The last image doesn’t seem to work.
I also don’t really understand your question.
It would be good to apply a coherence mask to reduce the result to pixels with high coherence.
I would like to know how can I interpret the profile plot? I don´t get the the x axis
These are the pixel values along the line you digitized. It is a cross section of the raster to see the variations of displacements as a transect.
Mr. ABraun, I have made the displacement map according to the webinar tutorial. Now how can I extract the displacement value from the map?Like actual displacement value in m or cm.