I’m currently facing an issue when adding a shapefile (multiple points geometry).
SNAP seems to read the file as it finds well the dataset’s bounding box.
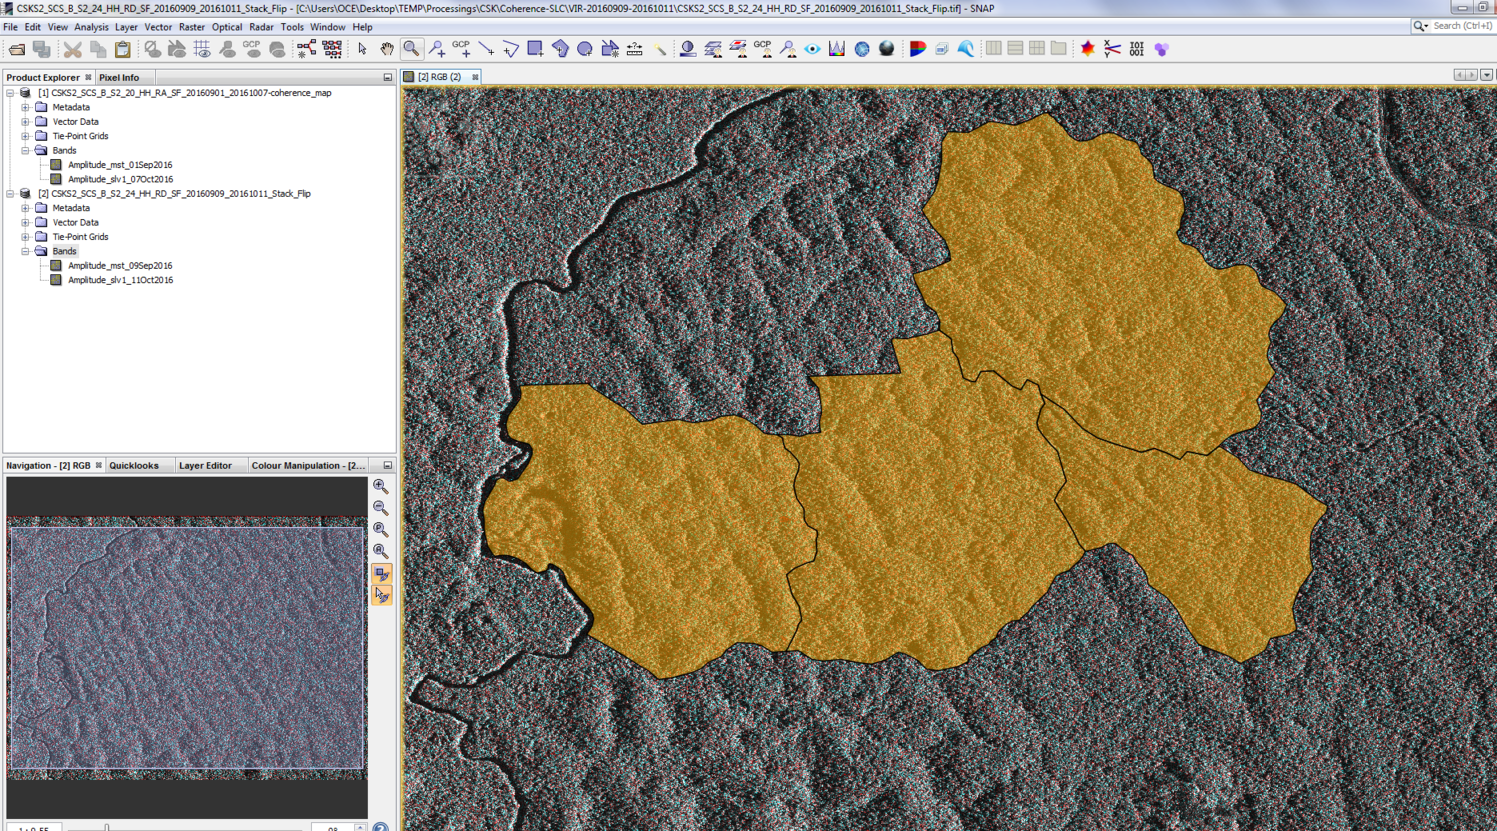
However, I cannot see the geometry when it is added to the Layer Manager (see the image).
Also, it works fine when opened on QGIS.
thank you for your answer.
Actually, these are Cosmo-SkyMed product in SLC (L1A) processing level. Amplitude has been extracted, and a coregistration between two products in interferometric conditions has been realised. Finally, products have been flipped (with the data flip tool) but they cannot be terrain corrected properly as there are no tie-point grids (from what I understood). All vectors are in same coordinate reference system.
What I forgot to mention is that I can add other vector (polygon shaped) from the same dataset and it works fine (see the attached image).
What do you mean by “open the vector alone in the layer manager”? It seems I cannot open a vector if there is not a raster opened.
Okay, I tried using a well geocoded and geoprojected SPOT image having the same bounding box than the SAR data but it still doesn’t work.
Maybe I am not adding correctly the vector importing tool (I’m using the LayerManager panel on the right side of the software) or maybe I am having some configuration error on points geometry : indeed, it is like the software recognizes the dataset when imported (bounding box is correct on the second step of the layer import process) but I cannot “see” the points when imported. I tried to configure the layer style of imported vectors but it seems it didn’t work.
Great! It worked for me too using that command.
Thx a lot !
Do you know how to edit the layer style afterwards ? I’m using the layer editor to modify it but it’s not working.
@ABraun Is there a way to highlight a particular attribute from the shapefile and view the corresponding in the image display area? Also any progress on modifying marks and colours of points? Thanks in advance!
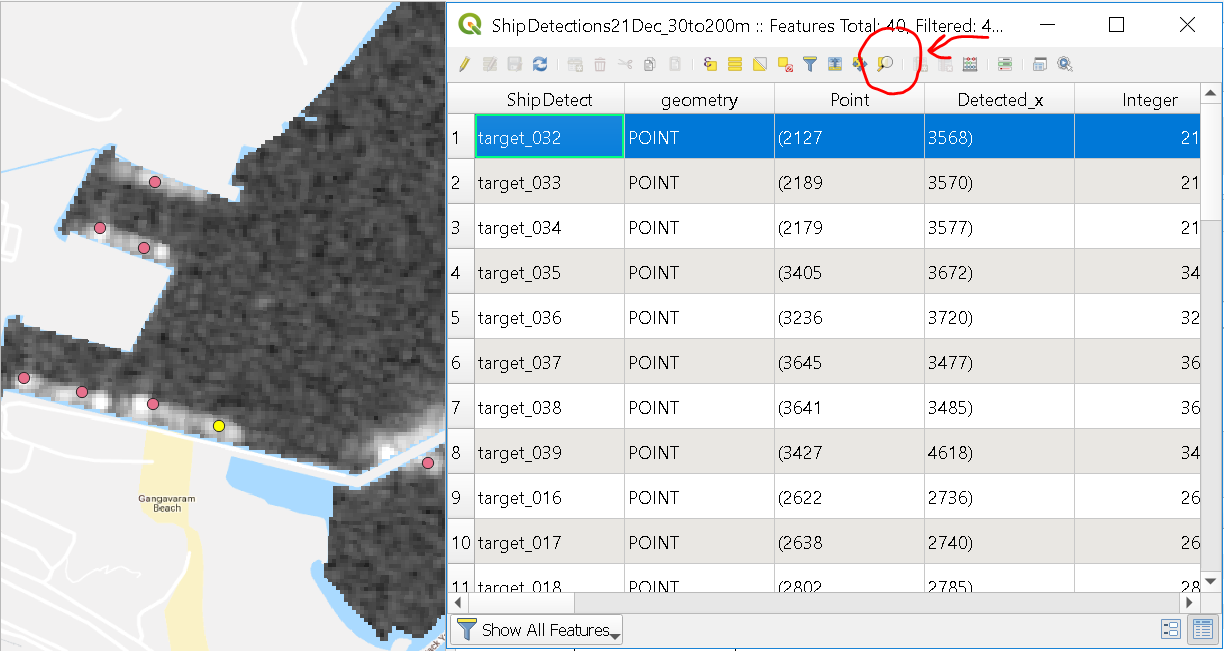
1). Zoom map to the selected row from attributes table. An example from QGIS is as below. I’ve selected a point from the attribute table and there’s an option to zoom in to that on the shapefile (shown in yellow)
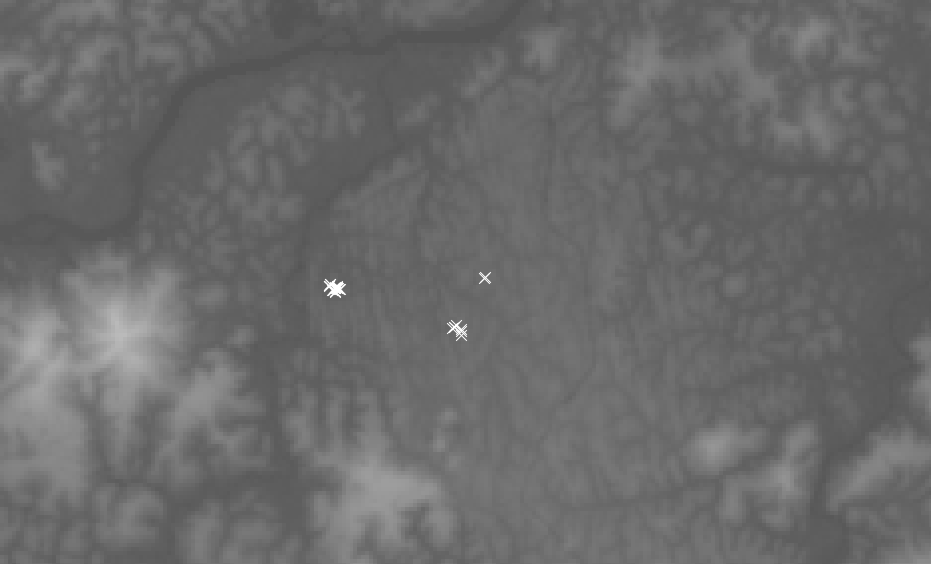
2)Sometimes it’s hard to see the “white cross marks” from the point shapefiles due to the image colors in the background. Are there options to enhance/modify symbology, change colour etc
I see, thank you for the explanation. The styling of vectors can be edited in the Layer Manager.
Regarding the zooming - if you work with pins, you have more flexibility regarding their handling in the Pin Manager. But I don’t know if points imported from a shapefile can easily be converted to pins.