Dear Abraun Sir
Thank you very much for your kind suggestion.
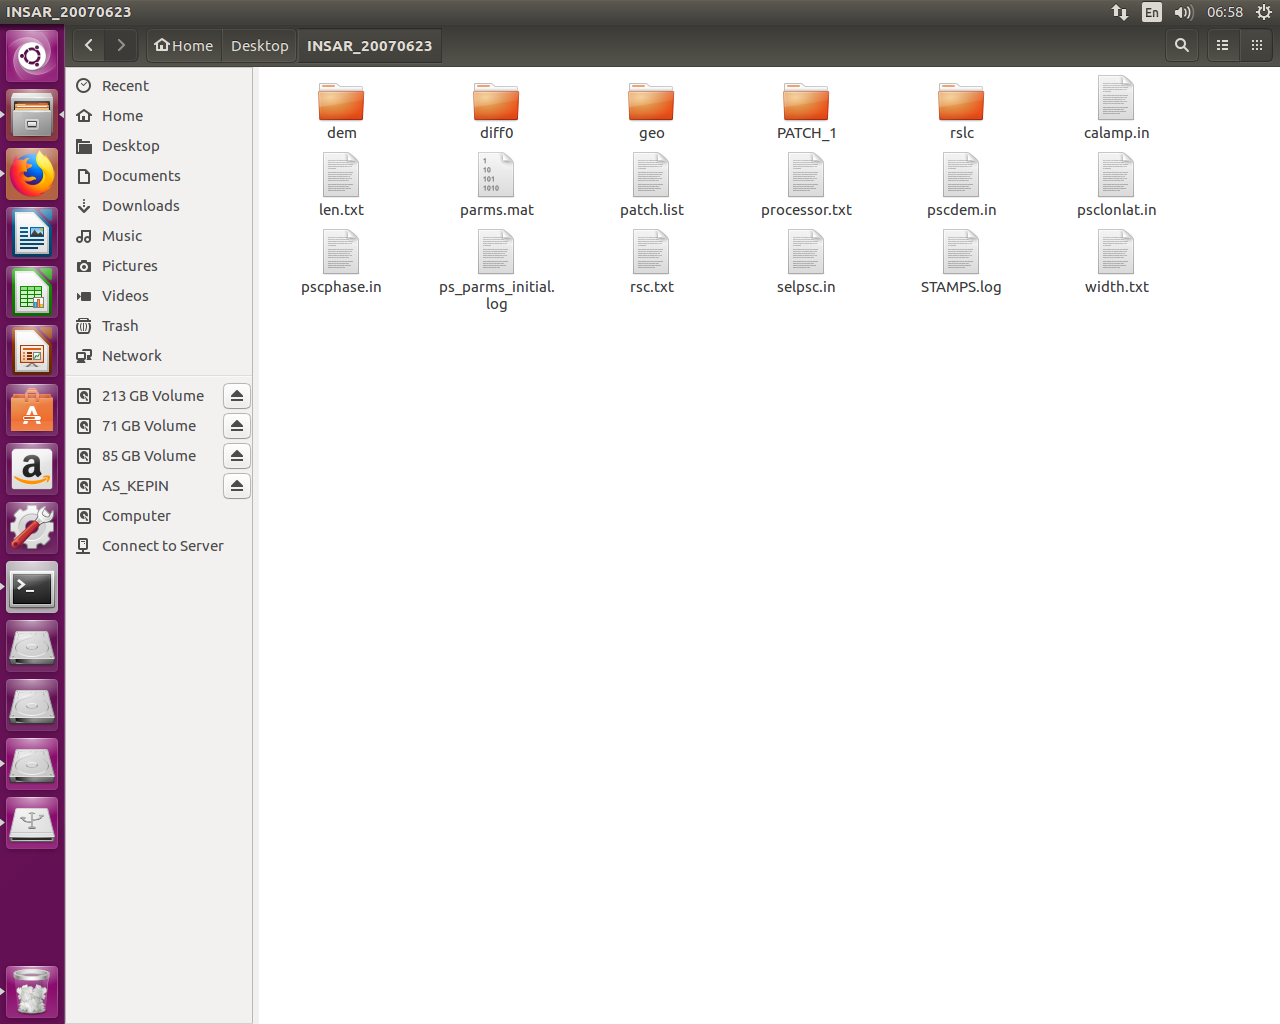
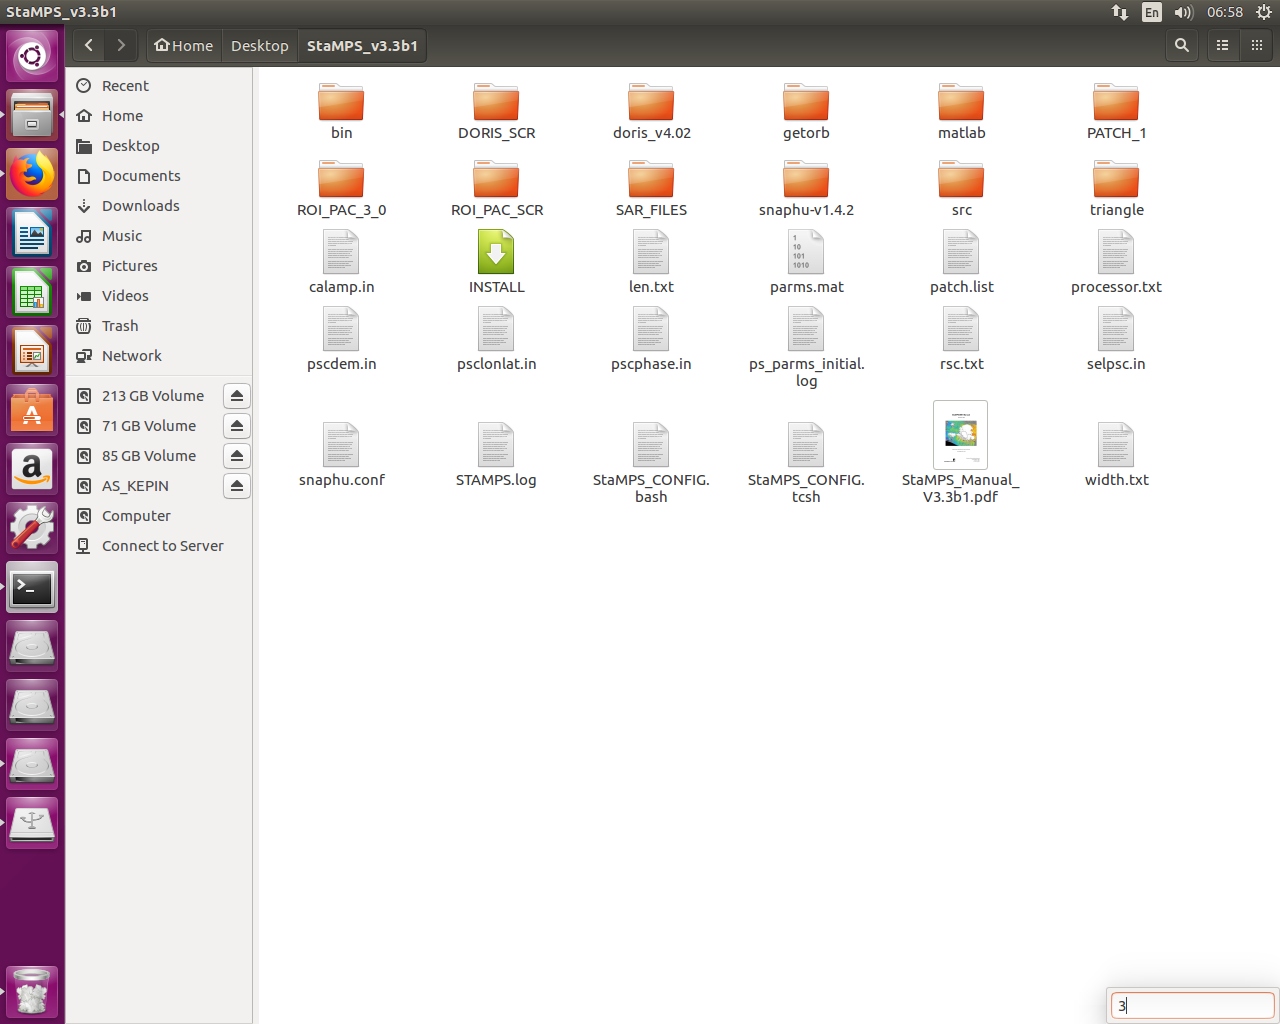
Now i have linux ubuntu operating system, which is new for me. I follow the comments and suggestion in this forum and try to run StaMPS.
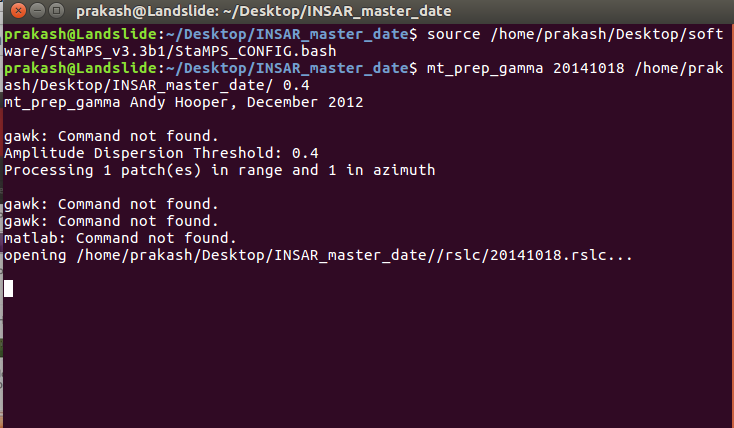
I dont know where it do mistake, but i get this message and it is running from last 5 hours.
Does anyone know how to set a master to a new stack?
Using @Katherine’s method, it is mentioned that I will require 2 stacks if I have data for 24 interferograms. How do I set the same master for the first stack to be used in my second stack of data? Or is it not a functionality available in SNAP yet? I have not been able to change it in stack overview.
Hi @hchong005
The first image of the list is counted as the Master so simply put your selected Master image in the top and all Slaves after that will work perfectly in SNAP.
Thanks for your reply. After using Mt_prep_snap step again, I’ve solved this problem.
I am working under Linux Ubuntu and I run the stamps in MATLAB 2015b version.
Now I meet a new problem: when I run the stamps(4,4) to patch 3, the matlab run a long time (about 1 day). I’m trying to change the number of patches, but it hasn’t changed and each time matlab was killed by Linux finally .My computer memory is 12G. Have you meet this problem?
Dear @1951878748,
have you made a spatial subset of your debursted stack and building ifgs from it afterwards, this could reduce computing time and needed RAM significantly? What dimensions in km or pixel does your study site have, maybe it is very large? I have not processed ifgs larger than two bursts maybe that could be a problem when using a machine with 12G RAM.
Can you provide your parameters of the step where Matlab is killed, the info printed directly under the step number when you have run the step, maybe we can find some hints there.
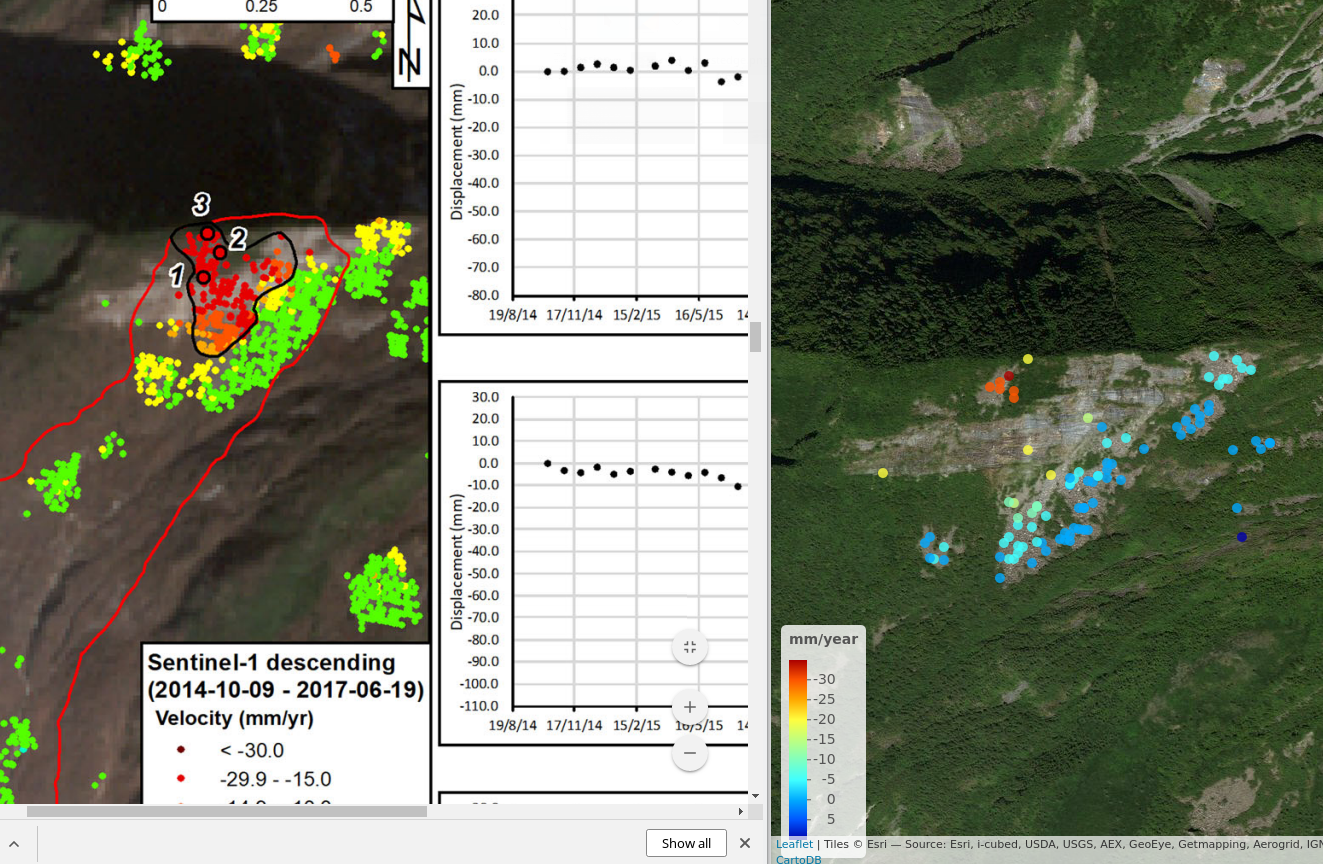
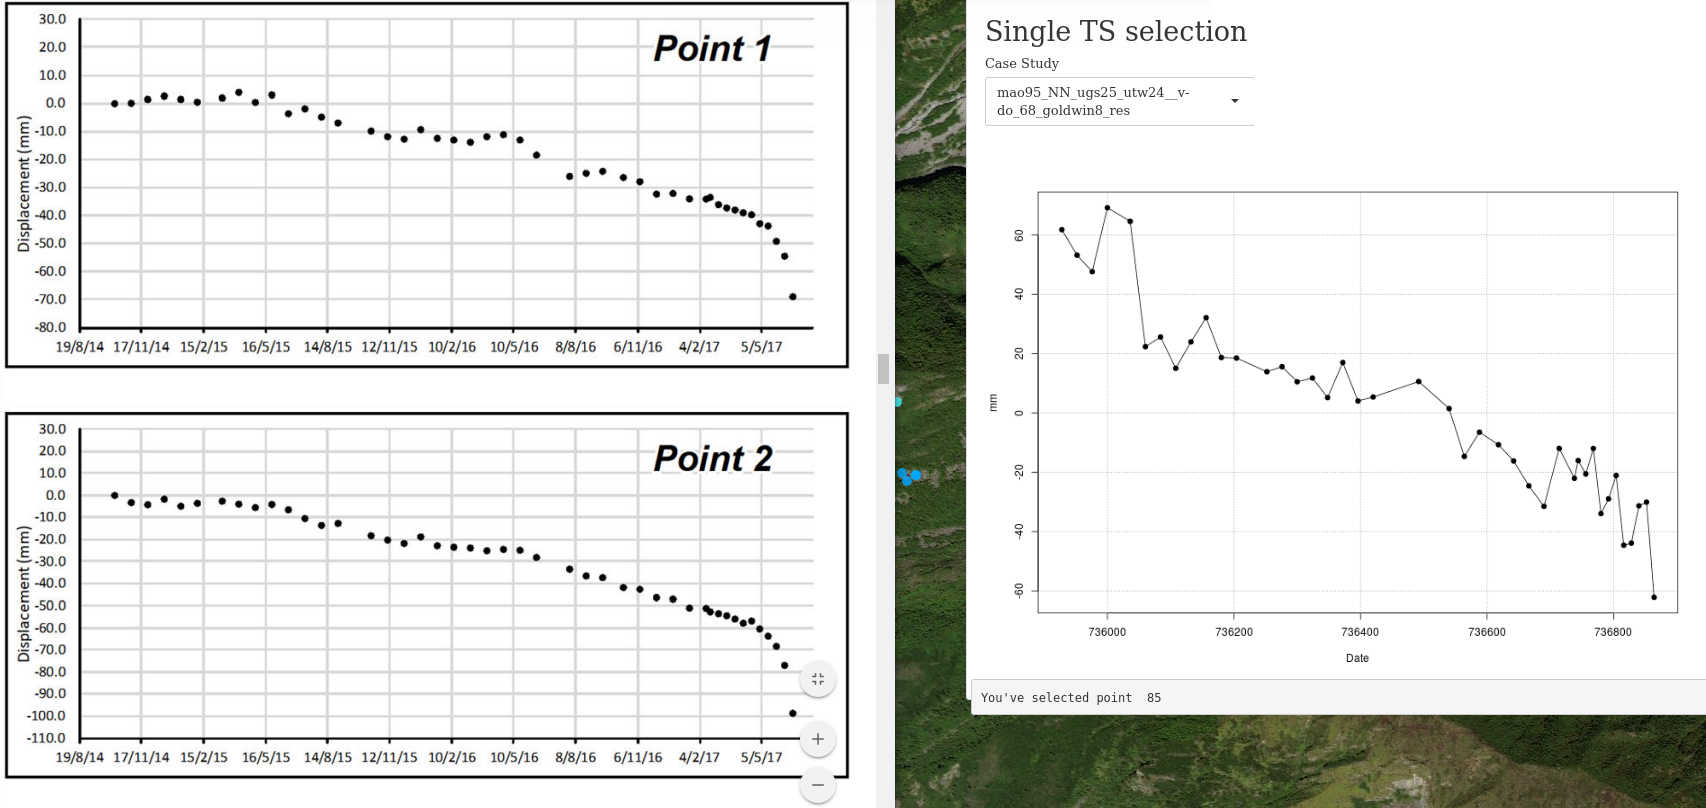
To give an example for a SNAP-StaMPS tutorial I am currently working with the Maoxian landslide case study, my goal is to produce a similar result as Intrieri et al. 2017 even if they used SBAS(SqueeSAR) I think some PS with StaMPS will show similar trends etc. (but maybe we can upgrade to SBAS sooner or later to and expand the tutorial:) ). The PS distribution and general velocity of my attempt look promising (left the paper of Intrieri et al. right the PS distribution found with StaMPS, both using the same S1 data. The Points 1,2,3 in the paper are in an area where StamPS finds the highest velocity too):
However I do have some trouble with the timeseries plot; at the moment it looks something like that (the data of the paper for reference on the left. The chosen PS to produce the right TS is the dark red one in the picture above velocity < -30mm/yr):
I know that I have to play with some parameters to get a better unwrapping result and subtracting atmosphere etc. The reason the trend starts at a much higher positive value is because 1. it is relative to a master ifg in April 2016 and 2. I use an other stable ref coordinate as the paper does.
But now my question:
The ifgs produced in SNAP are very noisy, I do not think this is major problem, StamPS was built to handle this, right? But if I operate the workflow on very noisy data/ifgs and when building the stack with BackgeocodingOP using a resampling method other than NN I think you must get wrong results because the kernels aggregate noise to pass it to the coregistered matrix. I am not quite sure about that idea, maybe you can help me to discuss that.
And maybe you do have an idea what I can try to get a better trend/unwrapping result, I think the project is nearly finished, when this problem is solved
Dear thho,
Thank you for your work to give an example for SNAP-StaMPS tutorial.
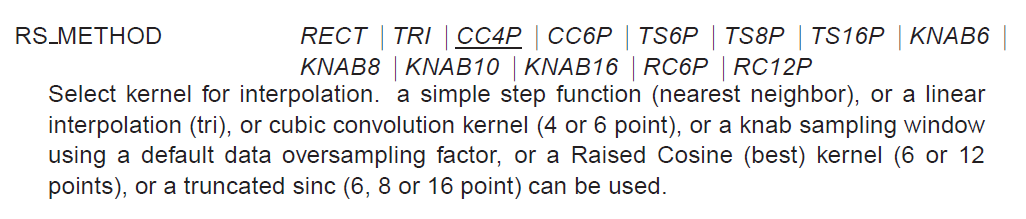
Just like you said, the noisy ifgs is not the major problem, however, when building the stack with BackgeocodingOP, the default resample method is BI(Bilinear_Interpolation), not NN(Nearest_Neighbour),and I do not meet any problem with the default method.
In theory, these two resample methods are not the best choise, according to the manual of doris_v4.02, Raised Cosin is best(theroy 0.9999), here are the screenshots of RESAMPLE step in Doris.
Doris manual:
As for better trend/unwrapping result, in my experience, I think these parameters should be more careful in StaMPS processing: density_rand in step 3 weed_standard_dev and weed_time_win in step 4 unwrap_grid_size and unwrap_time_win in step 6
And I am also very interested about your TS result, as I know, StaMPS can only get time linear deferomation, how did you get TS result like you plot? And did you use other data or software to subtract atmosphere?
Hi AndreyVahtanov,
Thank you for your report, however, I can’t see where the problem is just by your screenshots, can you show me more information about xy, bperp_mat or other matrix?


 .My computer memory is 12G. Have you meet this problem?
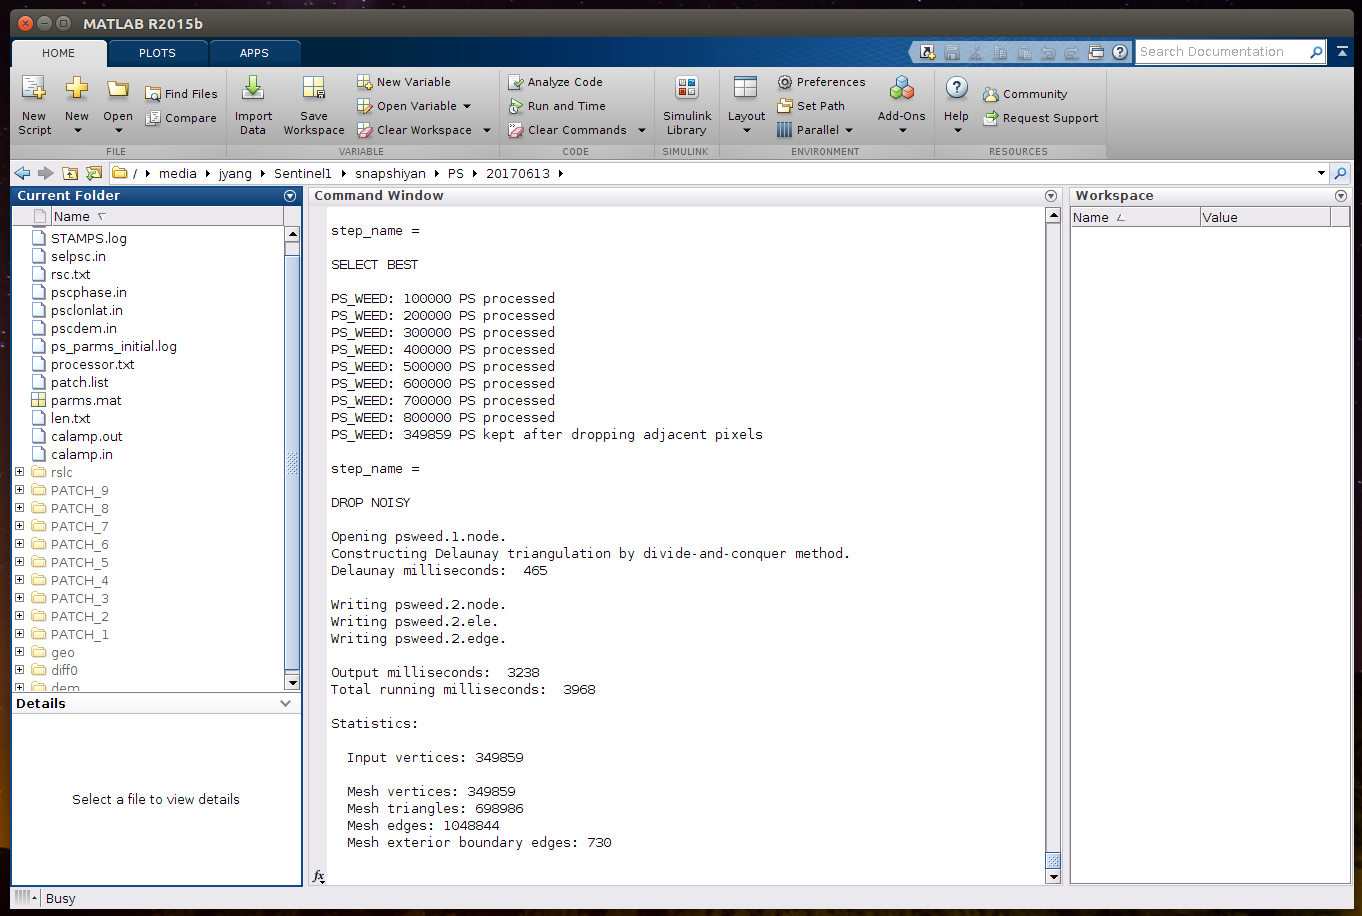

 .
.

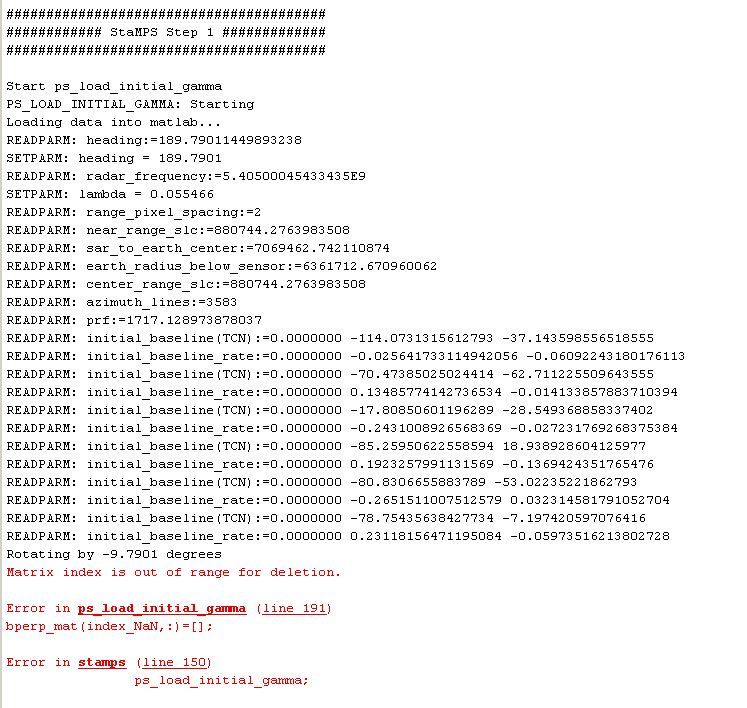
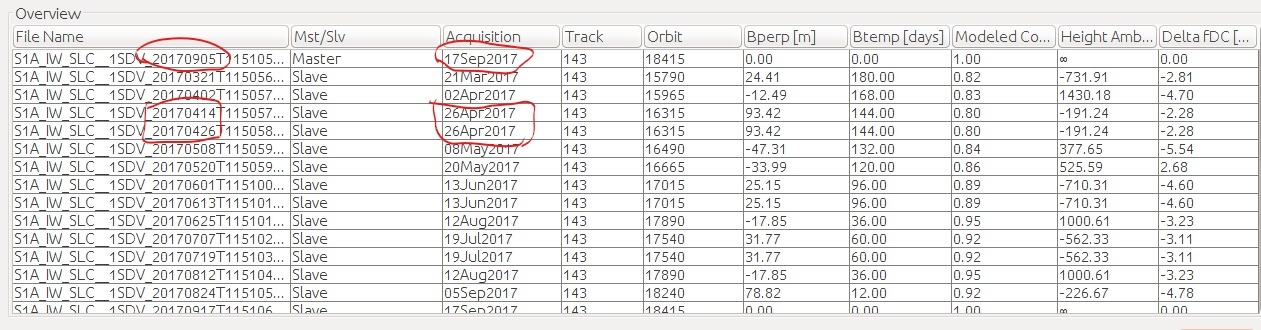
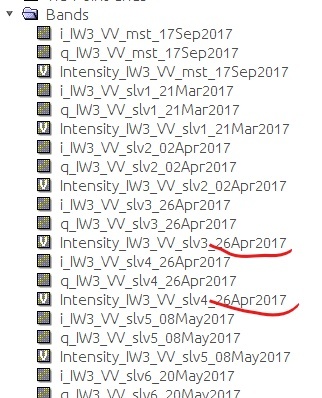
 please look at the place I marked.