your files look extremely small (150 kb). How large is your study area?
Nearly 0.9x0.8 km. I also enlarged study area but nothing has changed.
Area.kml (1.4 KB)
your area (besides that it is very small) rarely has any suitable permanent targets, given that the original footprint of Sentinel-1 SLC products is 3x22 meters (range and azimuth). The longer your time-series, the smaller the chance to capture PS which are present throughout all images. You are observing almost 2 years.
To get more PS, you can:
- increase the amplitude dispersion to 0.42 for mt_prep
- have a larger area
- reduce the time to one year for a start
Thank you for your suggestions Andreas. I will try as your said and write here the results. Best wishes.
Hi Andreas,
I reduced the time to one year, enlarged area and increased the amplitude dispersion to 0.42. It worked very well and I found 5-6 PS pixels in the study area. Thank you (:
In addition, to find more PS pixels in the study area, do you suggest any other specific hint?
how many images do you use within this year?
10 images between 2018.03.04-2018.12.05.
are these all available? Sometimes it is helpful to use denser image series to identify more PS.
I downloaded and used 10 of images. So, yes there are available. I will try the denser image series.
Hello, thank you very much for providing the step by step summary. however the link you provided seems broken. could you please provide the new link?
I had the same problem. Snap created an extra layer in my backgeocoded stack. I manually removed it and saved the layer. Problem solved
Hi everyone
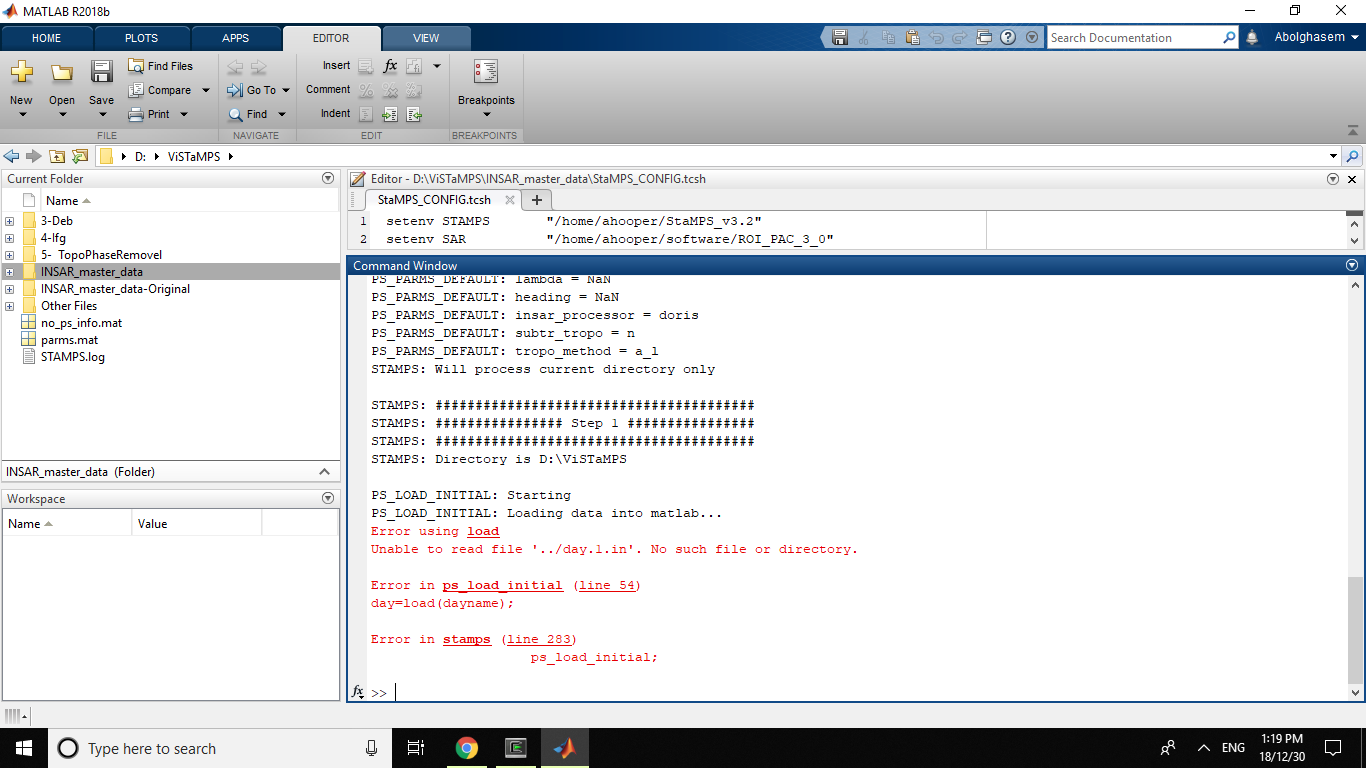
To do my Stamps processing, I encountered the following error.
Please advise me!!
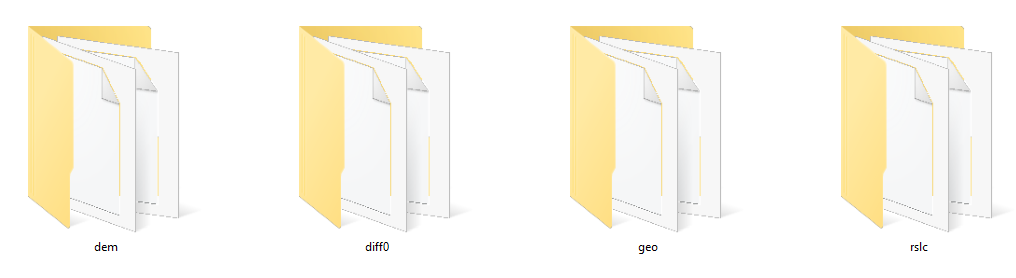
Please inform me steps after export from SNAP. I have below folders.
Should I merge them? where should locate them?
I have got the .csv file after the manipulate,but still i am confused to the csv chart composite, for example
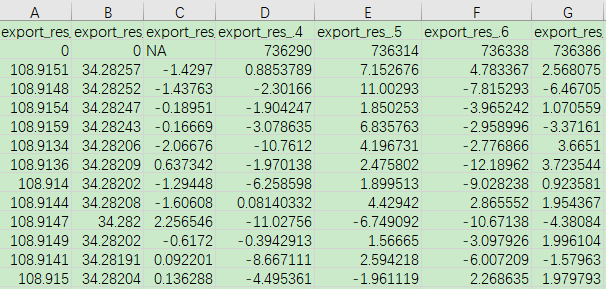
i want to know that the dispacement in the line D 、E\ F and so on descrips the accumulation displacement or the reference displacement ?and if it is a reference displacement ,what is the date that it is compared to ?a master sar date? i just want to compare the dispalcement to levelling data
My attempts to open a CSV file in QGIS are documented here: StaMPS-Visualizer, SNAP-StaMPS Workflow
thho explained it very well what the different columns and lines represent.
1 Like
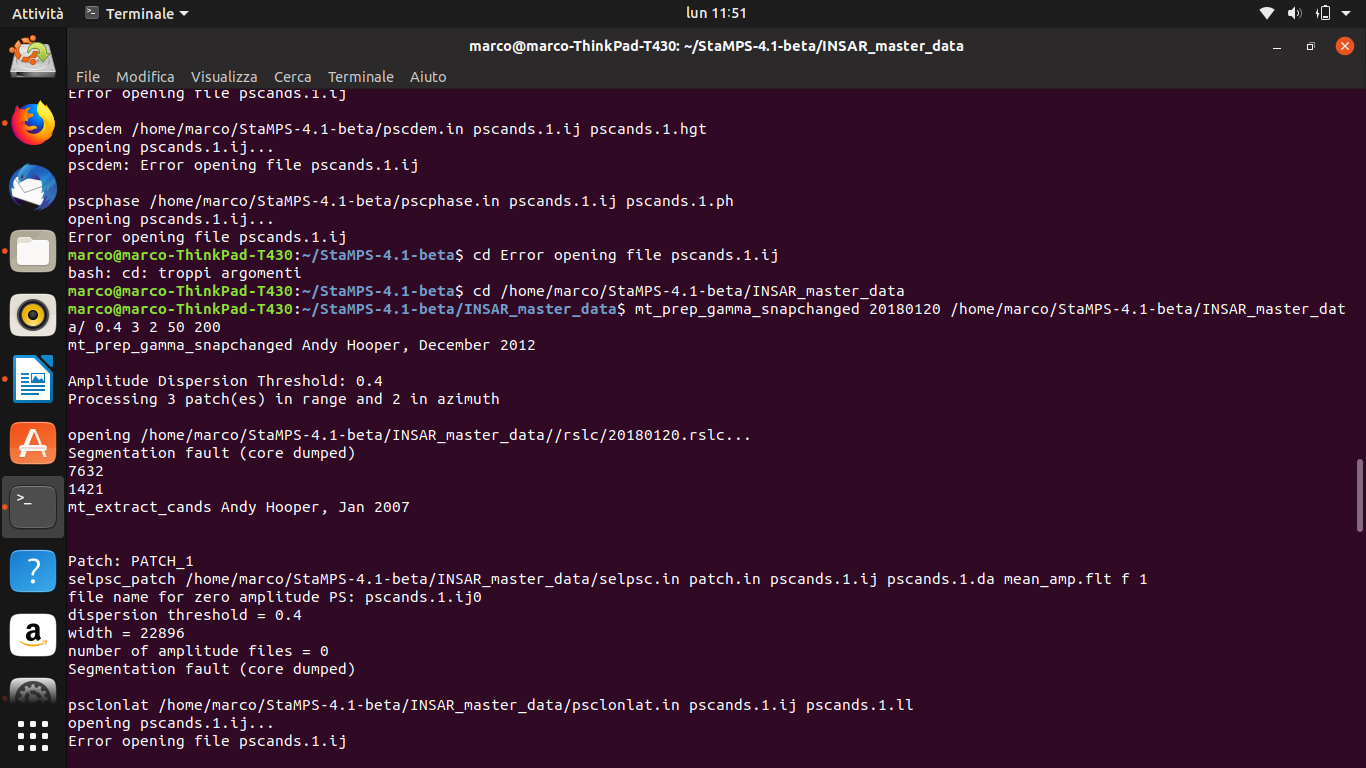
Hi everyone, I’m stuck with my PS processing at the step of mt_prep_gamma_snapchanged; the error is this one:
Error opening file pscands.1 ij
I read that also other of you have met the same errors but I can’t figure out how to fix it.
I’m wondering that maybe is due to a low number of processed images (5 images, 4 interferograms).
Anyone can help me?
Thanks a lot guys, this is a very useful forum.
I’m not sure if this caused the error but PS InSAR needs at least 20 images for proper results.
1 Like
Ok, I’ll process more images then.
Just for check if I made some mistakes, I attach my terminal session when I ran mt_prep:
Thanks for your reply.
the command looks alright. I can recommend running the command in a newly created directory so that all generated files are stored there separately from the INSAR folder. Helps cleaning up temporary files if something went wrong.
Dear all,
I see a Segmentation fault (core dumped) so probably you get something there to check it out.
I hope this helps
you’re right. I was just referring to the syntax of mt_prep_snap