But I also processed the same area before with SNAP v6.0 and StaMPS v3.3b.
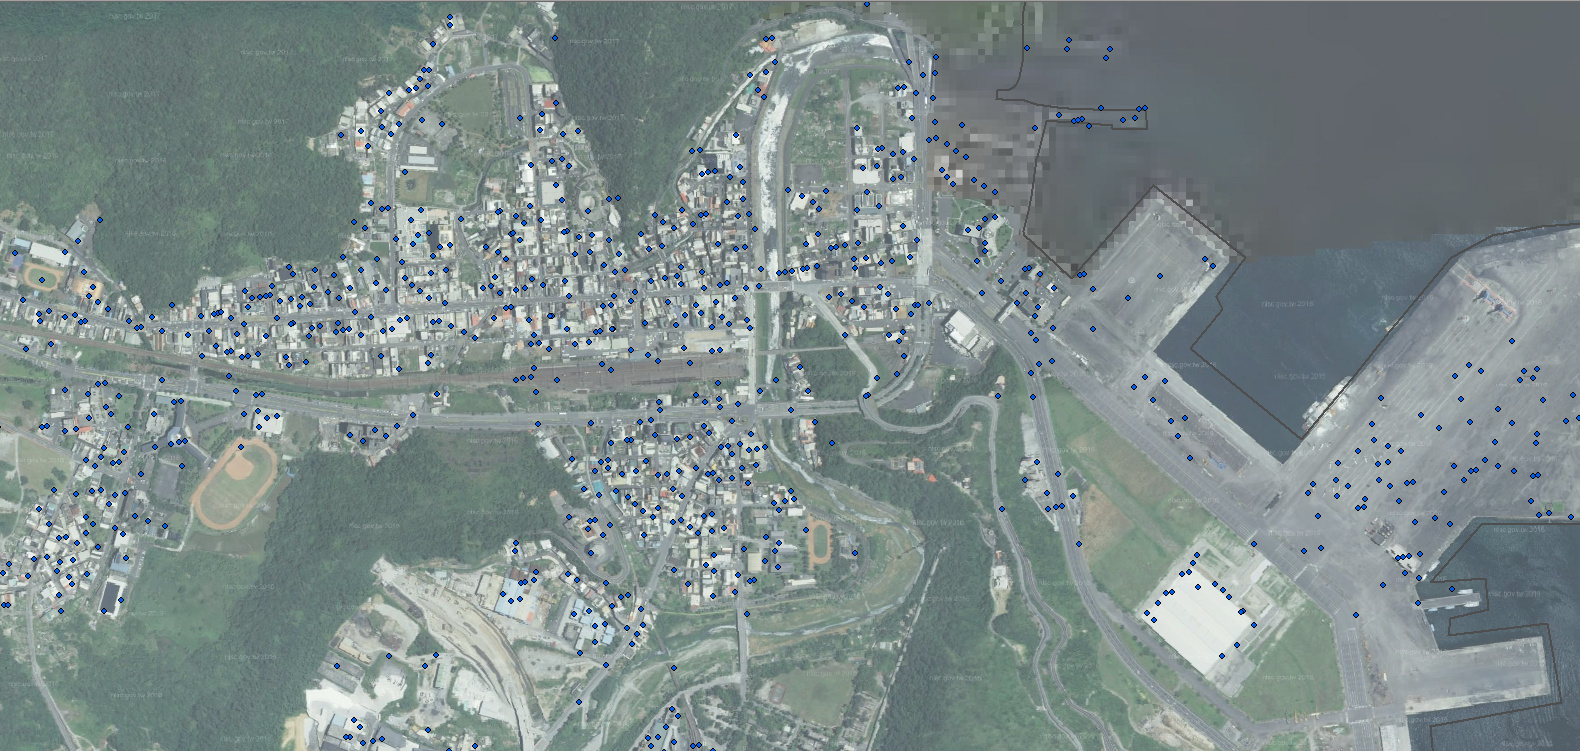
At that time, I used 66 images of sentinel-1a during 2014/10/22-2017/10/30, and the result with a basemap is as followed (to emphasize the distribution of PS, I use the same color of them):
In the result I got before, the distribution of PS points seems randon. Also, I never got linear alignment of the PS in other cases before.
Because this is the first time I processed sentinel 1a and 1b data together with SNAP v7.0.2 and StaMPS v4.1 in Windows Subsystem for Linux (ubuntu 18). So, I’m not sure the result I have now is correct or not…
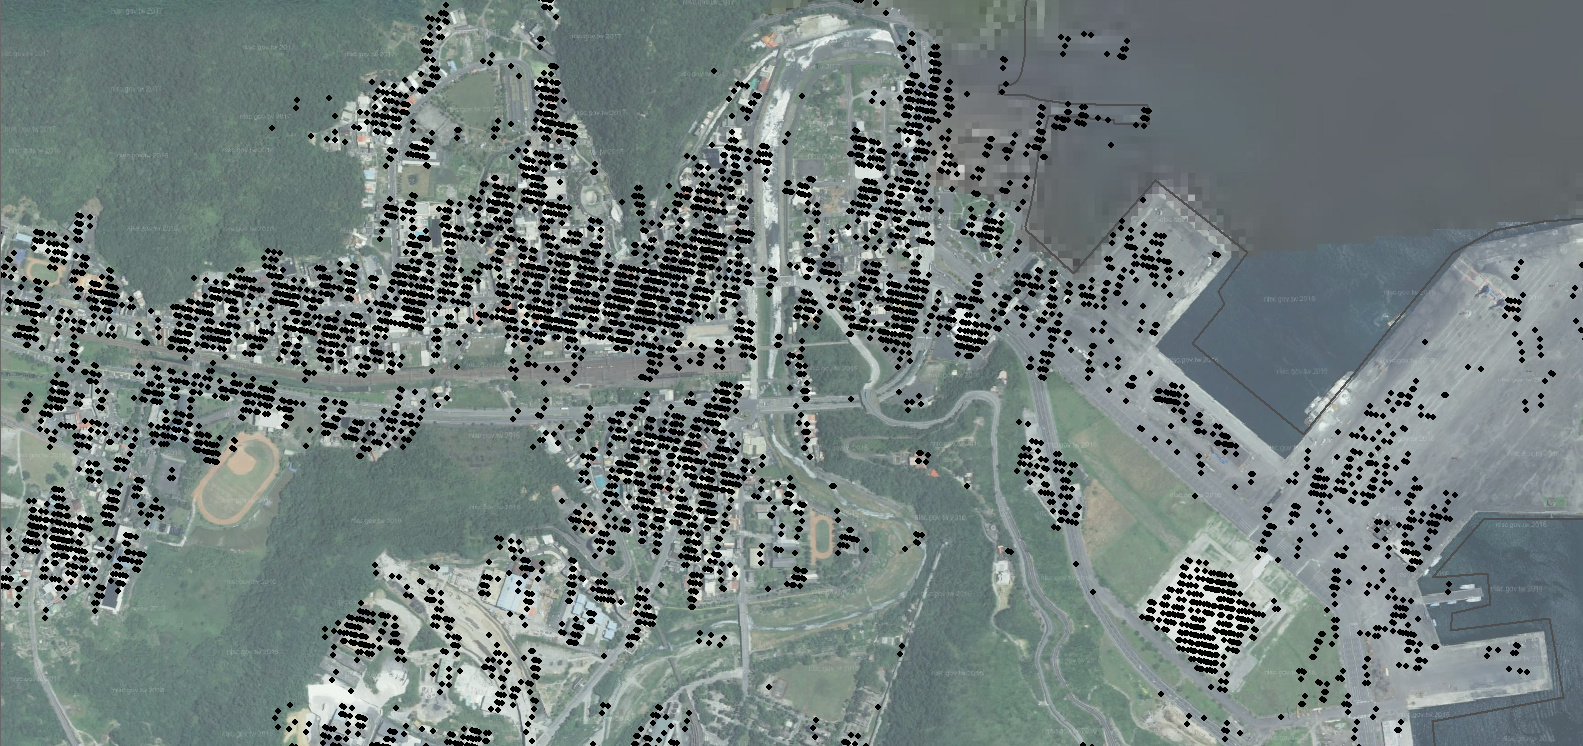
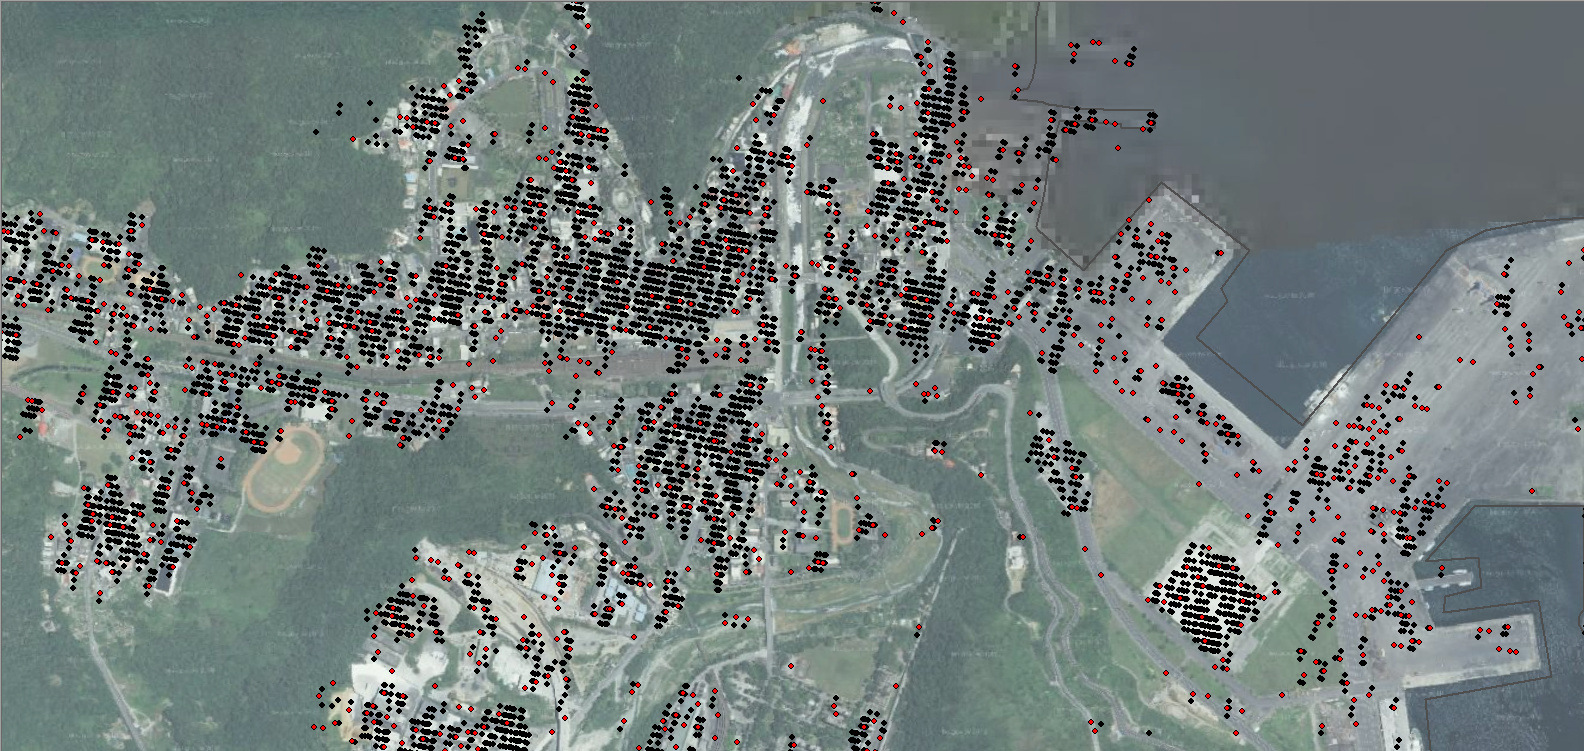
I just got the result (show as red point) using same imsges during 2019/01/01 - 2019/09/28 and parameters but processed with SNAP v6.0 and StaMPS v3.3b. They looks very different with the same data processed with SNAP v7.0 and Stmaps v4.1, the PS points show as black circle as followed:
I didn’t notice that one parameter default set is different between StaMPS v3.3b and v4.1.
In v3.3b, the “weed_neighbours” is “y”, but in v4.1 it default set is “n”. So, I got more PS points!
But, which one is better of the parameter “weed_neighbours”?
weeding should be strong enough to remove faulty or noisy PS, but still leave enough PS for the later steps. If the pattern you see makes sense, leave them in.
Dear Katerine, Daer other users,
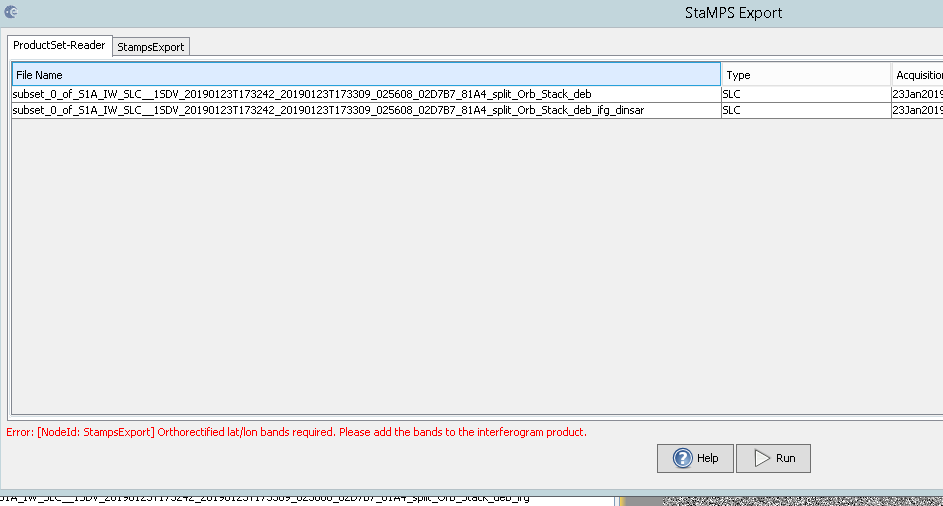
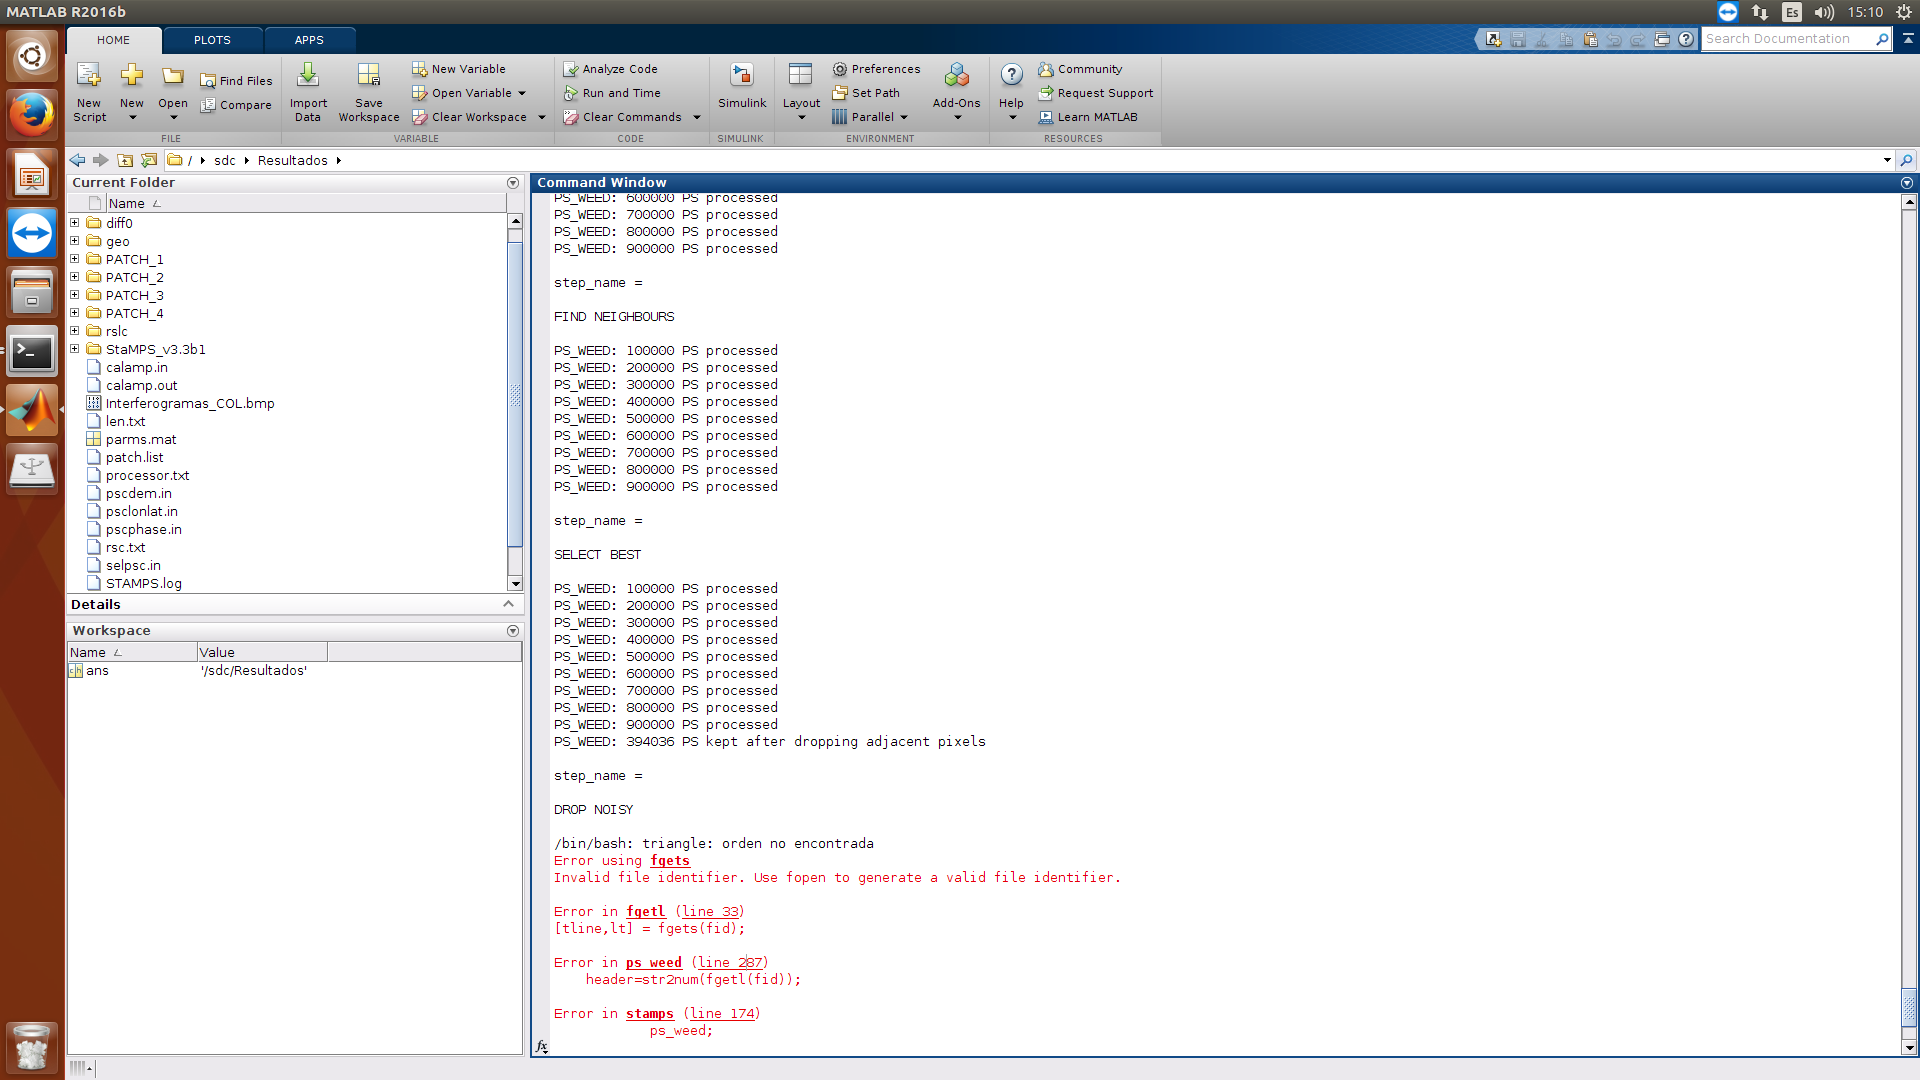
I have follow the steps that Katerine gave. Everything is going well except the StaMPS export.
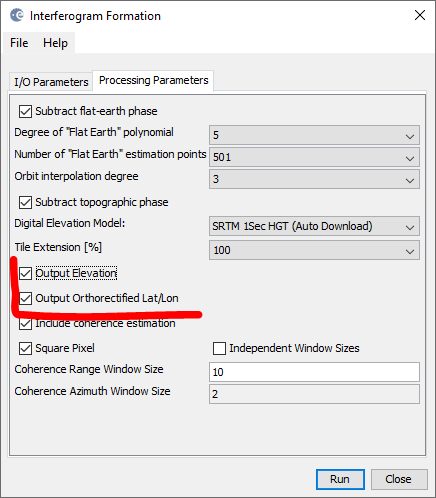
In the StaMPS Export, I have put the 2 right files but I faced a wrong message (“Orthorectified lat/long bands required. Please add the bands to the interferogram product”). I do not know why I received this particular message. Someone have an idea how I can solve it. Thanks for your support and your help.
Francois
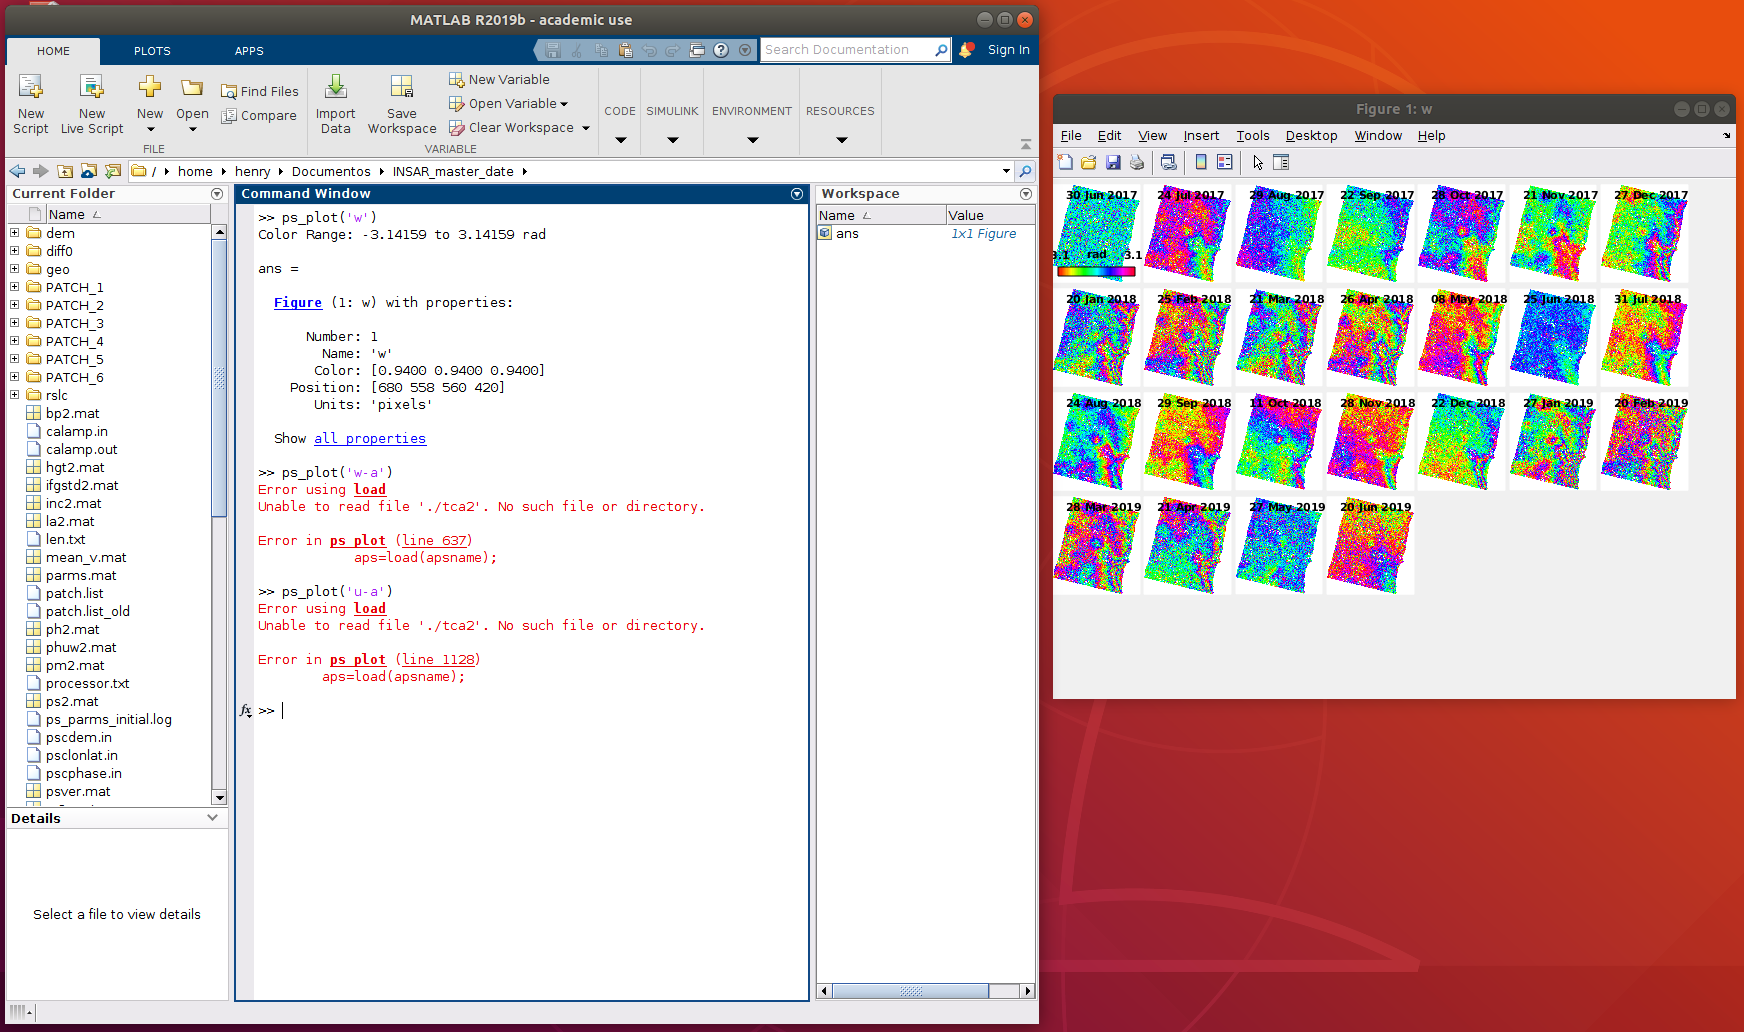
For variable ‘a’ you must run atmospheric correction from TRAIN you can find in https://davidbekaert.com/
And to plot ‘a’ you must add additional string e.g. ps_plot(‘u-a’,‘a_linear’).