if you are free , could you please share some experiences about how to use Global Mapper and Surface to draw the pictures from data in StaMPS.
Thank you !
Oh,a beautiful graph!could you tell how you create it ?Thank you !
Hello,
It is about saving your results and drawing each of result as shaded relief map into the Surfer program. It takes a bit time according to your data. But first you need to plot your result into Global mapper and export the data as Surfer .grd data. These programs are easy to use but not free. If you find a way, I can assist you to plot your results as same as mine.
Fikret
i have got these two programs.it is need to take me some time to learn.so if you are free ,i hope to get some advices and help.Thank you!
Hello again,
First of all, did you obtain result figures ? For example, mean_LOS velocity map? If you obtain that, you can export the values using matlab and you have LAT and LON values too. Then you need to creat LAT, LON, mean_LOS values respectively into the .dat file. If you make that tell me, afterwards it is time to use global mapper.
Fikret
hello!i have got the graph you mentioned!but ,sorry ,i don’t know where and how to export the result!i have read the mannual again but couldn’t find.could you give me some hints?thank you!
What are value .base file in diff0 floder, which get from stamps export
Those files show 2 value, it contain “initial baseline(meters unit)” and initial_baseline_rate(meter/second). question is how to calculate both value in .base file.
Hello,
Do you mean in Matlab or Grapher? Could you write your stage clearly? You can write my mail directly if you want. I dont want to flood this info page with our draw issues. It is:
fikretjfm@gmail.com
Hi @gsw220 it was created in GMT 6.0, I exported my results from StaMPS and MATLAB in .xy files!!! and plotted the ps_mean_v.xy file!!!
I am trying to do PSI analysis and I have prepared the workflow from this doc https://eost.unistra.fr/fileadmin/upload/EOST/MDIS_presentation/MDIS2019_SNAP2StaMPS_demo.pdf . I did S1 Tops split, selected swath and seperated the bursts for my area and then applied orbit file. I want to carry out DInSAR and further export to stamps. I am following the workflow in the image for 2nd step. My doubt is that where I should add the subset option to perform the DInSAR analysis in the graph. Please help
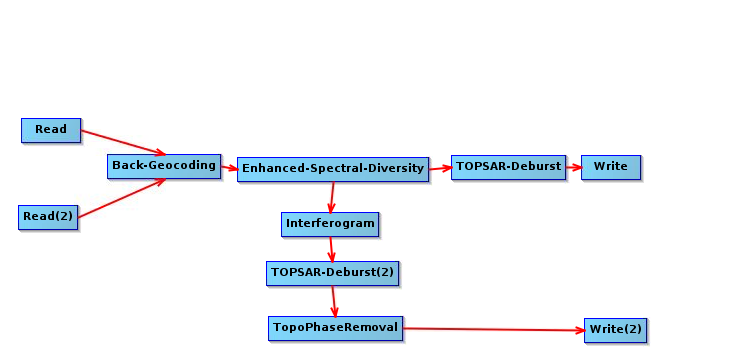
Is it ok if I perform the subset by adding it after Deburst and before ifg?
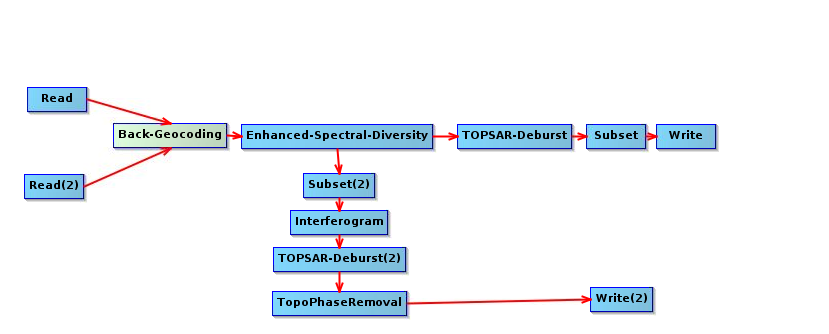
I think it is better to apply both subsets after Deburst.
As suggested in the PDF, you can use the snap2stamps python scripts which automatically clip your data according to the bounding box coordinates given in the config file.
1 Like
Hi ABraun, I encountered the same problem as m477h145, that is, after running stamps (3,3), I found that none of the PS points were selected.
In addition, when D_A = 0.6 and density_rand = 2000, the result is still the same.
Is it because decorrelation is too serious? What do you think is the possible cause?
It can have many reasons, how does your interferogram / coherence look like?
1 Like
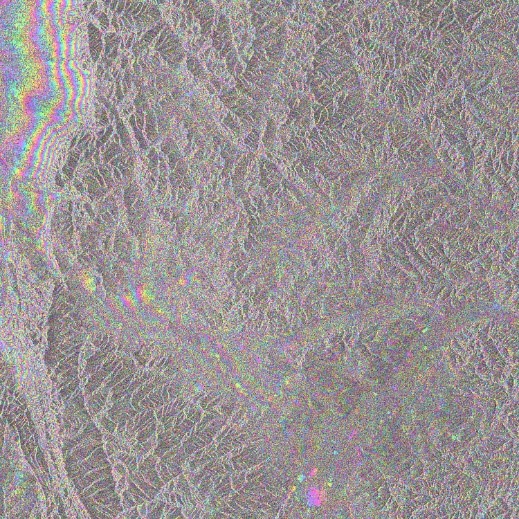
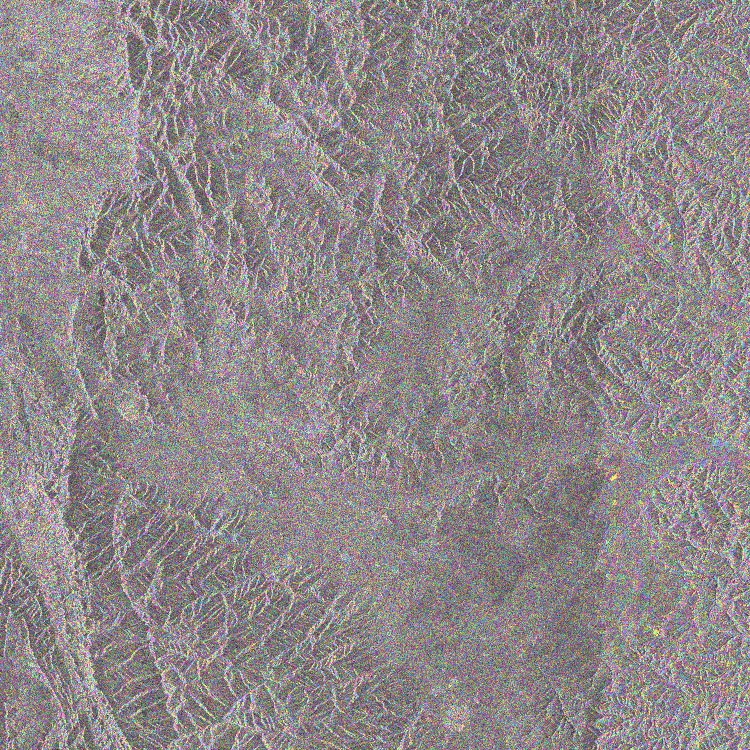
Figure 1: interferogram with reference phase removed
Figure 2: interferogram with reference phase and topographical phase removed
From the two pictures, it seems that after the topographical phase is removed, the noise is greater.
topographic phase removal is required so that the fringes that remain represent the acutal surface changes. The fringes you see in the image above are mainly caused by topographic variation.
Have you checked the output of mt_prep_snap if there are enough pixels without zero amplitude?
1 Like
I agree with @Abraun. Normally if you passed step 2 means that means that your master and slaves are ok, but step 3 with such problem can be normally linked to wrong interferograms.
It is always important to check that the files look fine (both amplitude and interferograms) before starting processing StaMPS. That allow you to identify potential issues afterwards.
2 Likes
Hello @gabrielaquintana77, after listening to the suggestions of @Abraun, @mdelgado, I checked the data processing process and found that there is indeed an interferograms with an amplitude of 0. You have encountered this kind of problem before, how did you solve it?
could it be that in this this interferogram master and slave are from the same date?
You can, either retry, or as @abraun said, check whether the interferogram is master-master.
If there is master-slave you can :
- try again
- remove the ones with 0 amplitude from the folder rslc both files rslc and rslc.par , and from the diff0 the files belonging to that slave Master_slave.*
then run mt_prep_snap again
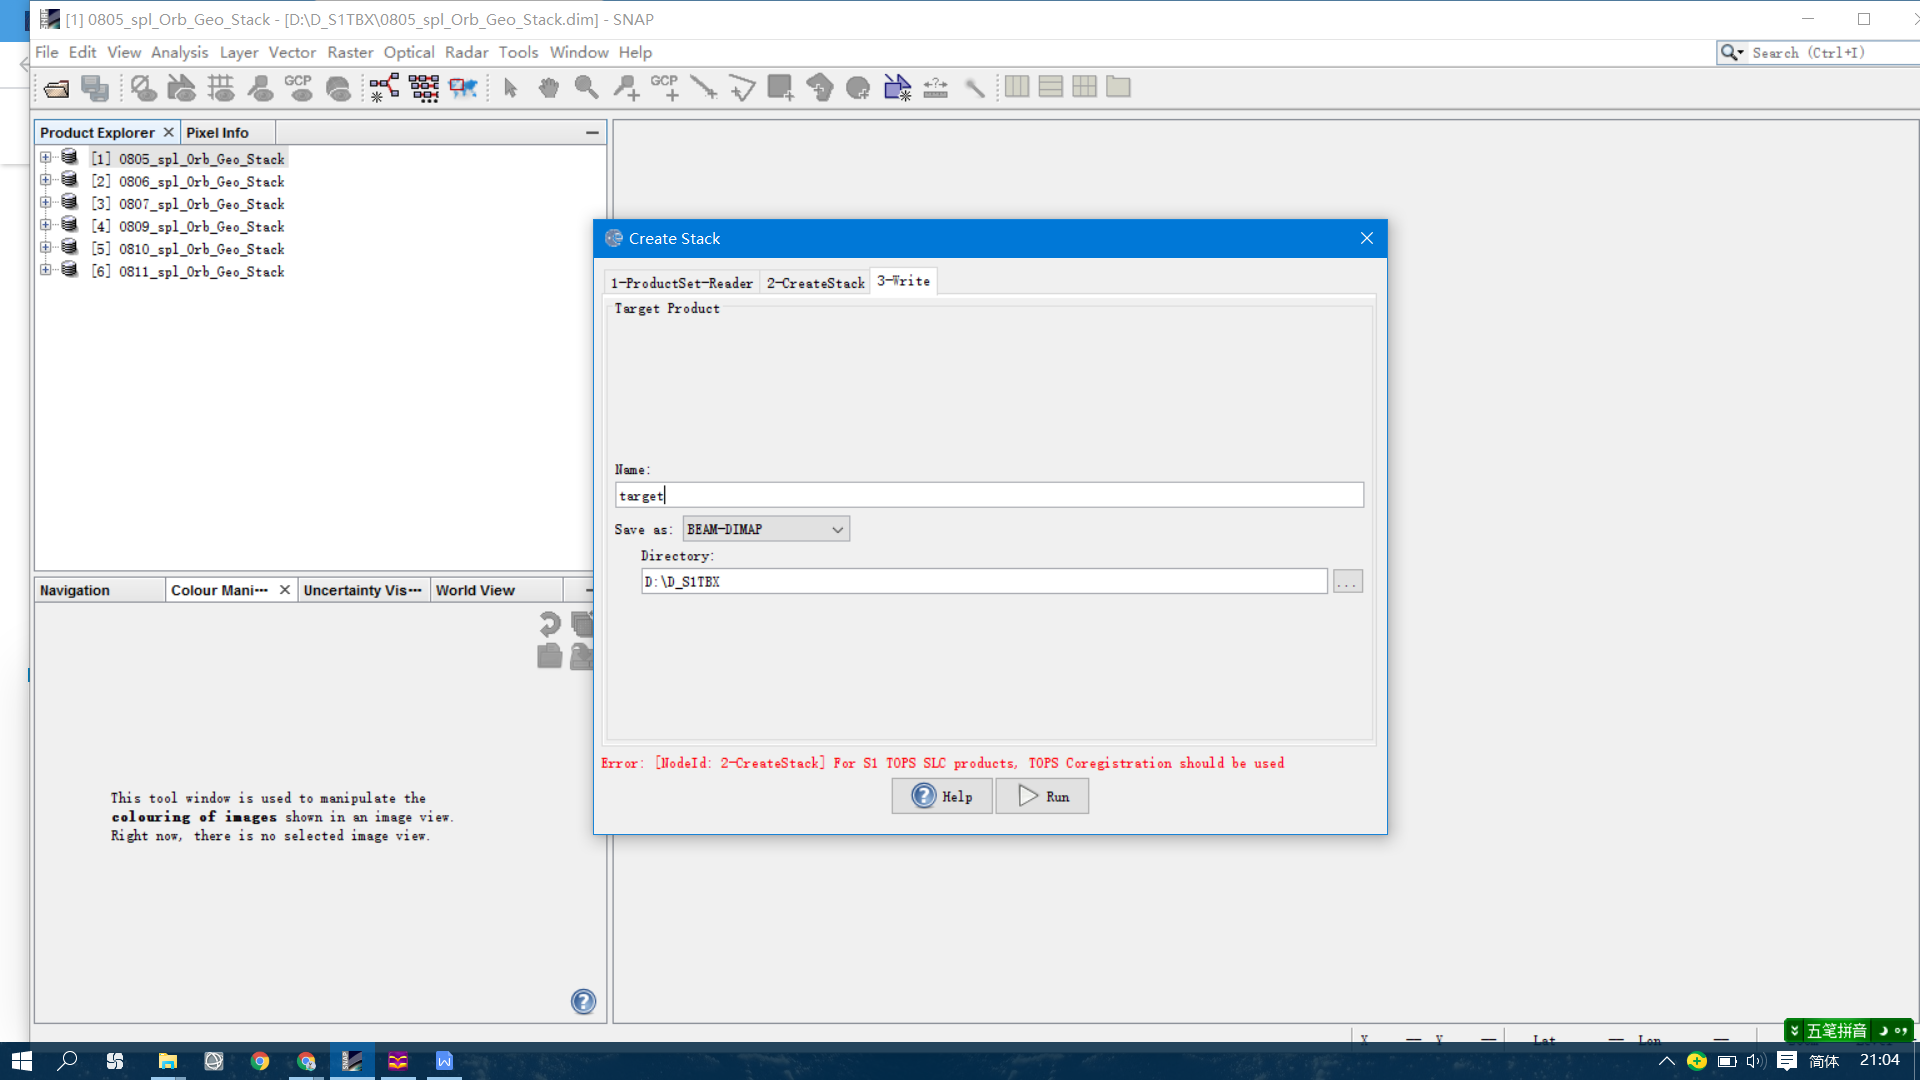
@katherine:I’m new in PSI, form beginning of create stack with snap7(Radar-Coregistration-S-1Tops_Coregistration-S-1Backgeocoding with ESD ),I’ve build 5 pairs stacks with 6 images such as :master+slave1,master+slave2…master+slave5. then I’d like to create a stack which include 5pairs as you 2017.11.16 has mentioned,then,error occurs: “S1 TOPS SLC products should use TOPS Coregistration” .why? can I do it with band math?
,or can you teach me how to create the stack like yours?thanks!