ABraun
April 26, 2017, 3:00pm
#24
you probably did nothing wrong but repeat pass interferometry (scenes from different dates) cannot produce high quality DEMs in most cases. How many days are your scenes apart?
Oh,this is the data I use.
TSX1_SAR__SSC______SM_S_SRA_20140610T225348_20140610T225356.xml TSX1_SAR__SSC______SM_S_SRA_20140702T225349_20140702T225357.xml
ABraun
April 26, 2017, 3:21pm
#26
can you open both data sets and select Menu > Radar > Interferometric > InSAR Stack Overview
Add Opened > Overview
and post a screenshot of it?
Thanks,this is screenshot,
The front ofthe screenshot is my subset of the image,the full image is
ABraun
April 26, 2017, 5:21pm
#30
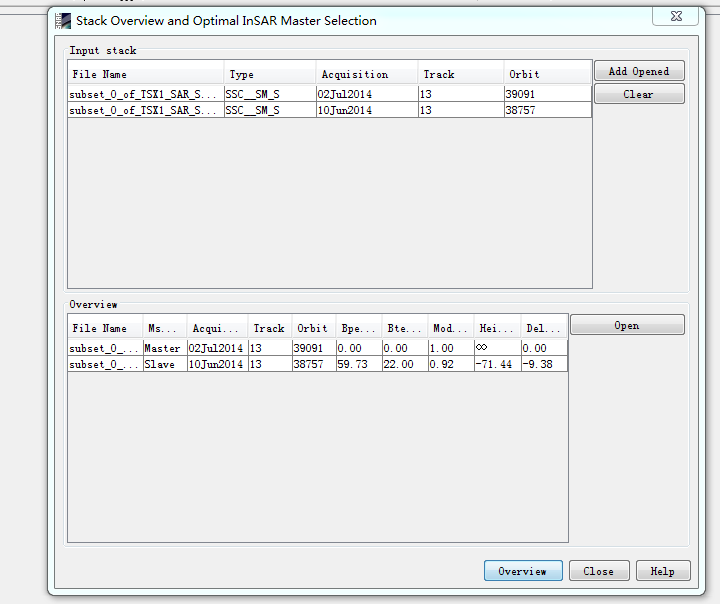
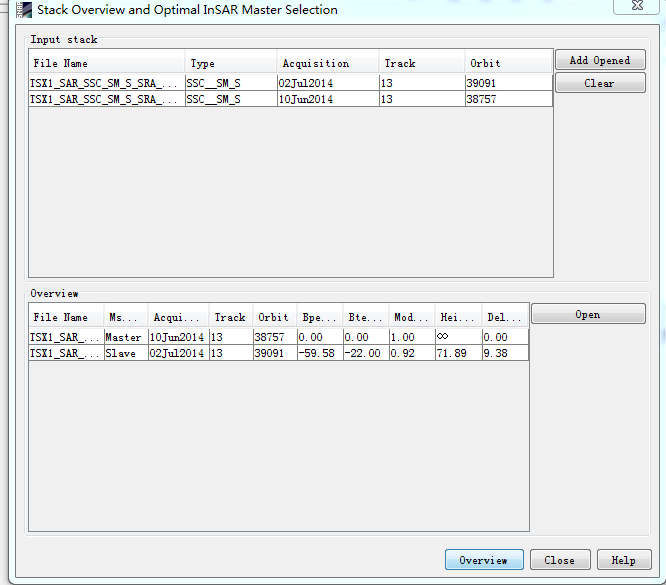
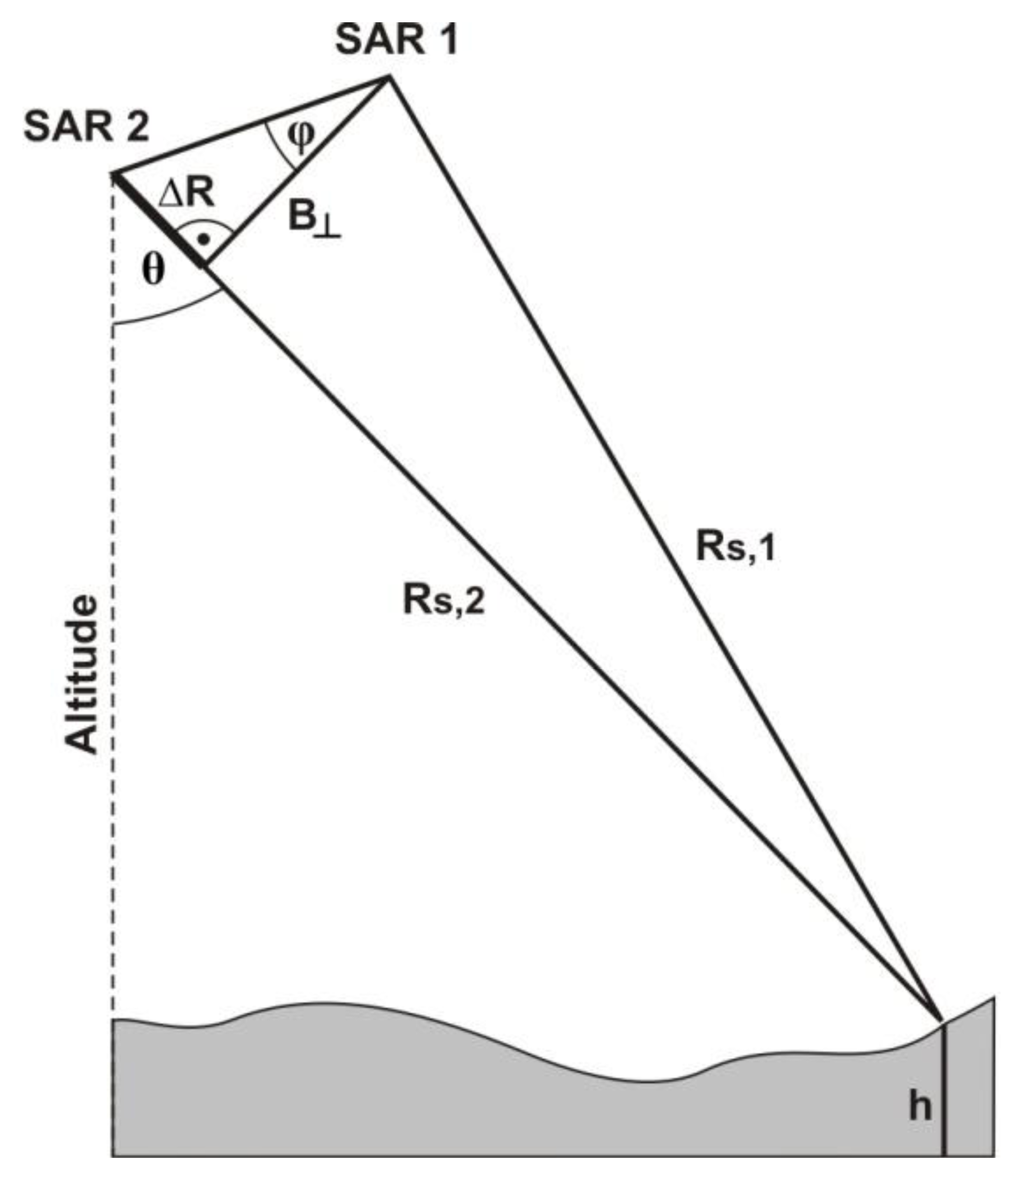
as you see, they are 22 days apart. Bperp means the distance between the satellite positions at the two different dates:
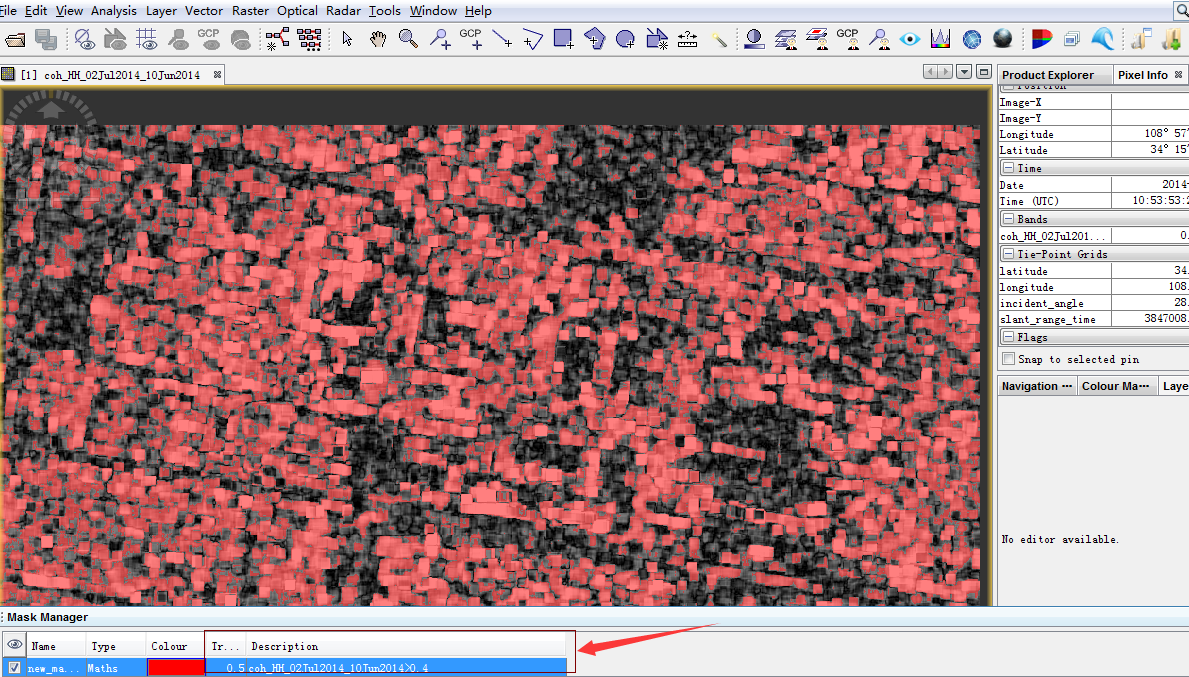
High coherence is needed for good results. Did you compute a coherence layer with your interferogram? Only locations with a coherence of > 0.4 can be used/trusted for the DEM generation.
X-band is comparably short and looses much coherence with longer time. So it’s most likely temporal decorrelation which lowers your InSAR quality .
Please also see here:
Atmospheric phase cannot be removed by a SNAP module as it cannot be modeled, like flat earth phase or topographic phase, for example. If you would make reference measurements of water vapor or have dense time-series data (example ) you could theoretically remove the atmospherical phase distortions. This is advanced however (example 2 ).
You calculate an interferogram between a pair of images. It shows you the differences between both images regarding their single phase signal. As the satelli…
Hi @ABraun ,
this post and your comments are a very good walk through, thank you all! Is the following quote your experience or are can you recommend literature?
I’m afraid the time between the two images is too long. This leads to temporal decorrelation of the signal and the loss of proper SAR fringes (and low coherence values).
Here you can see the coherence steadily decline over time. As it is a measure for the quality of InSAR your observed patterns seem reasonable. Note the blue coherence values for ALOS in the third column and how they decrease with longer time intervals:
[image]
Source:
http://topex.ucsd.edu/sandwell/publications/129.pdf
Oh,maybe it’s temporal decorrelation.This is coherence of interferogram.
ABraun
April 27, 2017, 6:06am
#32
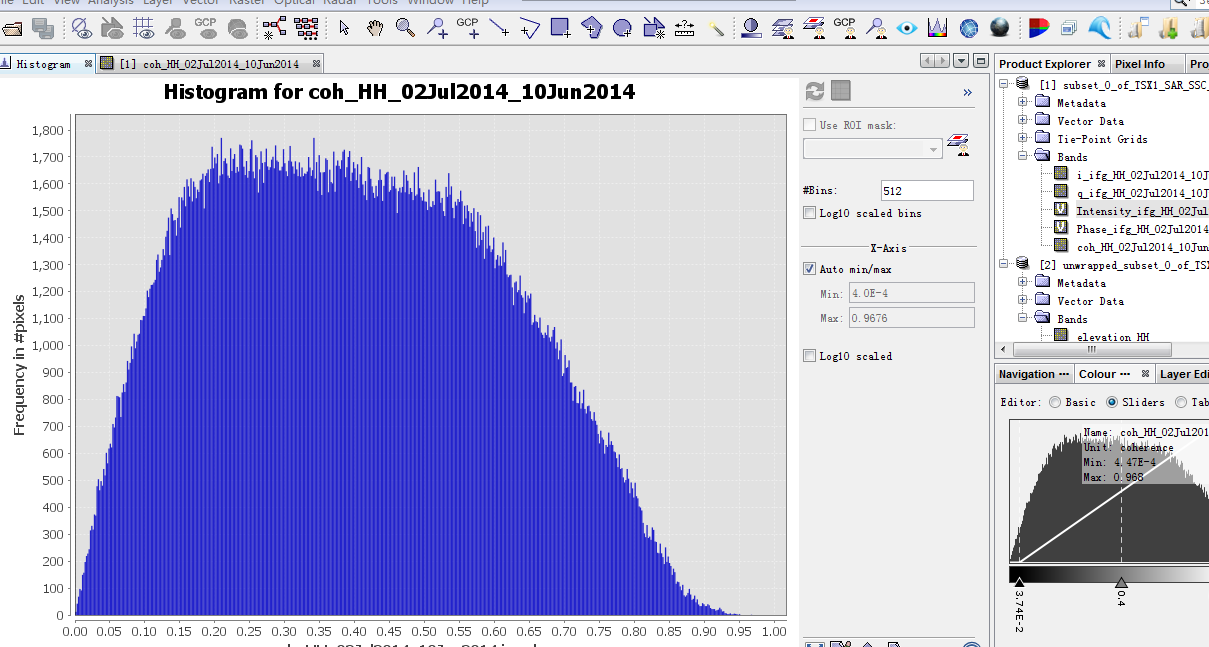
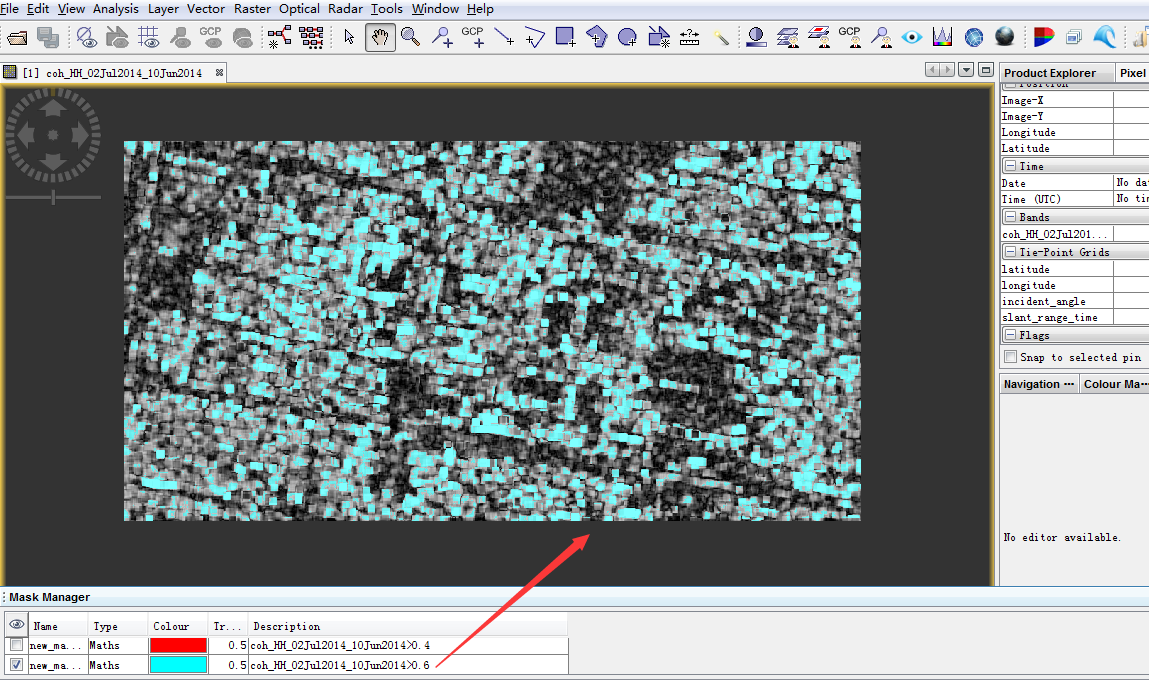
yes, probably. You can also have a look at the coherence raster where in your image your result is of good quality.
You can then mask your interferogram according to these areas:
Layer properties > valid pixel expression, for example coh_HH_11Feb2008_04Mar2008 > 0.6
Even if coherence was > 0.9 the atmospheric artefacts would still cause large DEM-errors in the repeat-pass case.
maybe I could try use a image(the time is 20140621)to interferorgam with image which I have ,
ABraun
April 27, 2017, 2:56pm
#35
you can compare coherence of different image pairs and see which is best.
Maybe also atmospheric influences are different for other pairs.