Hi everyone, I would appreciate some help or advice on a project I am undertaking at the moment.
I want to identify blight disease in potatoes with sentinel 2 data over an area of interest. I was reading up on some spectral indices that are good for highlighting this such as Leaf Area Index (LAI), Leaf Chlorphlly Content (LCC) and canopy chlorophyll content (CCC).
However would I be better of first identifying potatoes (with sentinel 1) and then trying these spectral indices or any other recommend ones?
a two-step procedure, as you suggest, makes sense to me. First you separate the potato fields, then you investigate the variation of indices within the fields.
For the separation of agricultural crops, for example with the mask manager, the tutorial on Time-series analysis with Sentinel-1 might be helpful to you.
I am following similiar workflow in this tutorial by Dr. Chris Stewart (https://www.youtube.com/watch?v=htme1WfRPh0&t=1s) however when I make a stack of my images I get the error ‘pos < flushedPos!’.
Any idea as to why I cannot create a stack?
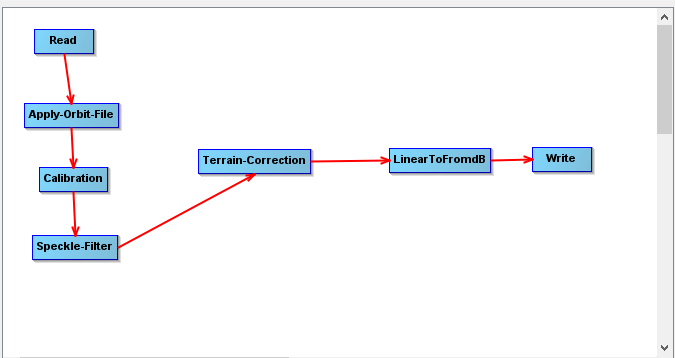
This is what I have entered in my Batch Processing.
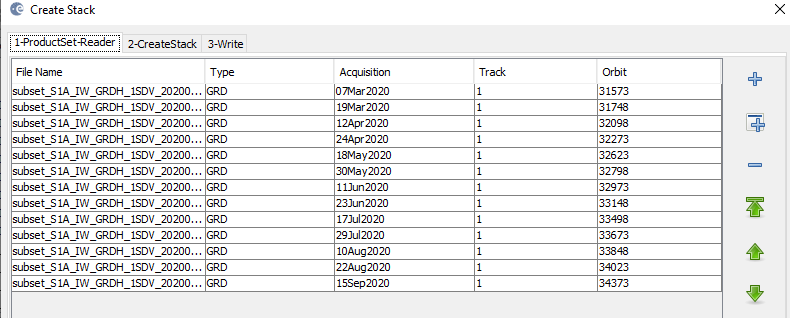
I have checked all 14 images and there was one that was partially done so I have removed it from when I create a stack and I seem to get the same error.
Here are the 13 images I am using to create a stack.
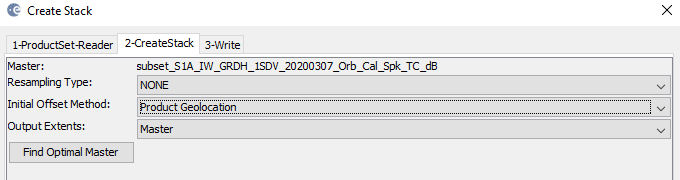
Would you suggest changing changing here such as Resampling type? Or initial offset method from geolocation to orbit? I used apply orbit file in my processing graph, should I have not used apply orbit file?
@mengdahl from analyzing a few academic papers around crop mapping there are certain crops that react better to different polarizations. For example, Veloso et. al (2017) in Understanding the temporal behavior of crops using Sentinel-1 and Sentinel-2-like data for agricultural applications found that rapeseed and wheat could be better distinguished using single polarizations of VV and VH. For barley and maize VH/VV ratio was more prominent than single polarizations. Would you know if there is a certain polarization that has been effective for identifying potatoes?
I don’t know if there’s a general answer to your question but studying the literature may help. In any case processing both polarisations is “easy” so why avoid it? You would most probably even benefit from InSAR-coherence but there processing is significantly more involved and expensive.