Hello,
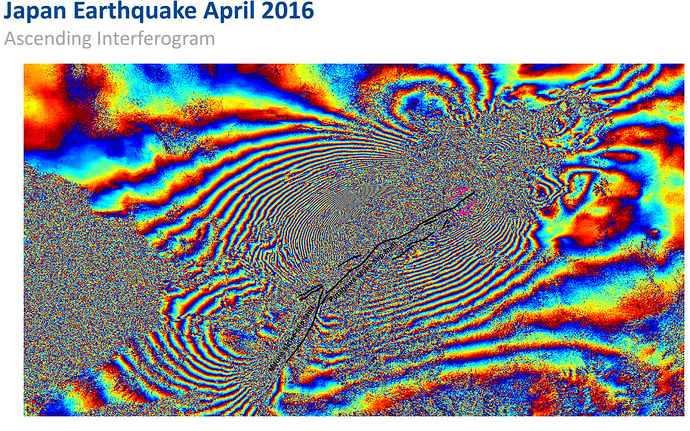
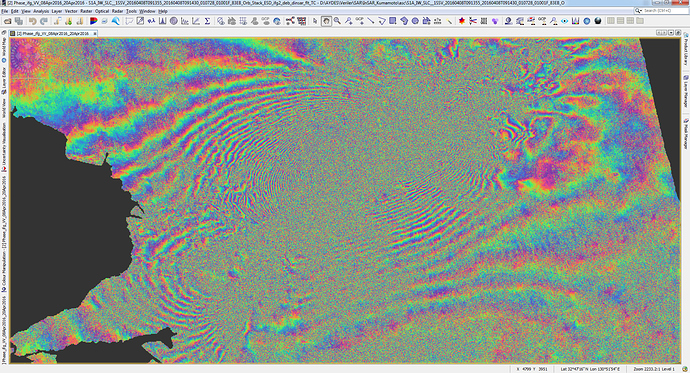
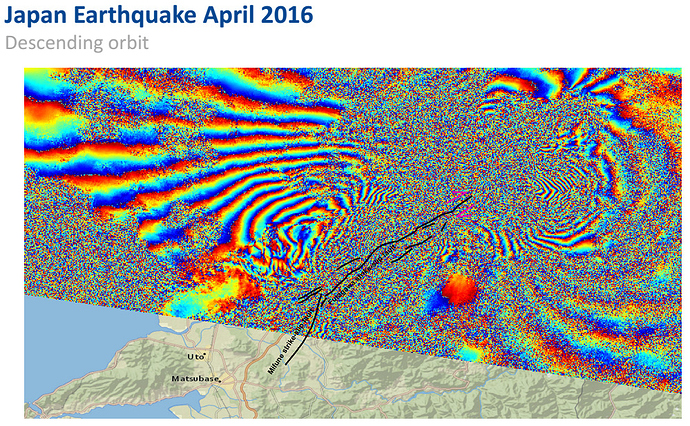
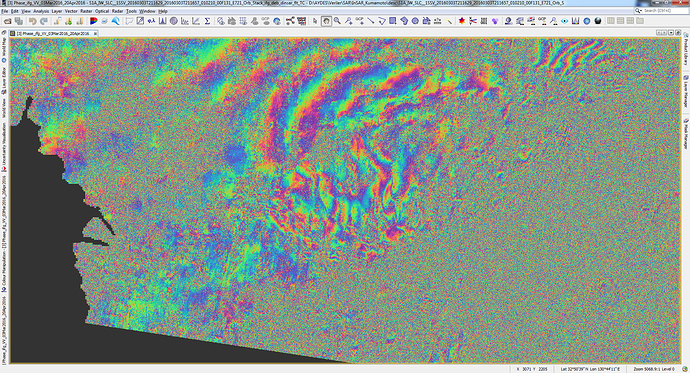
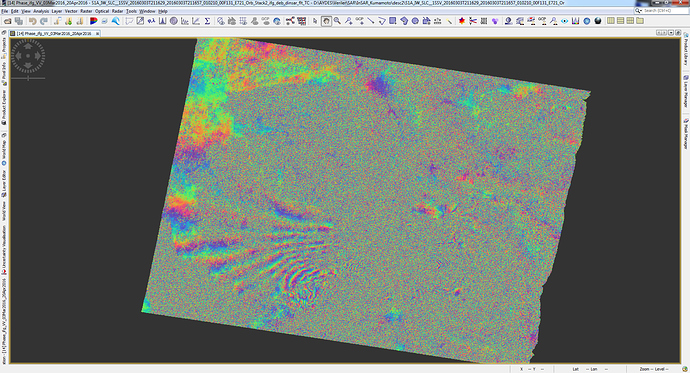
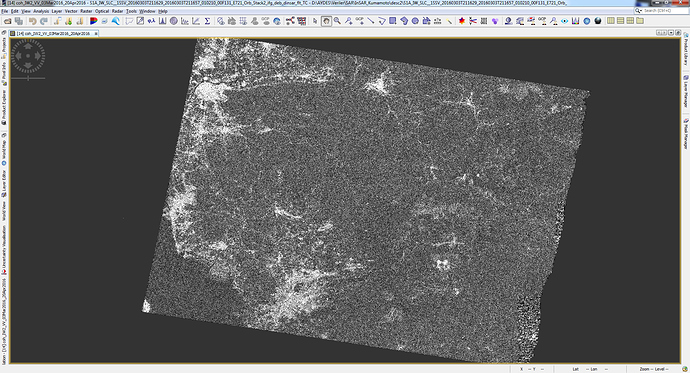
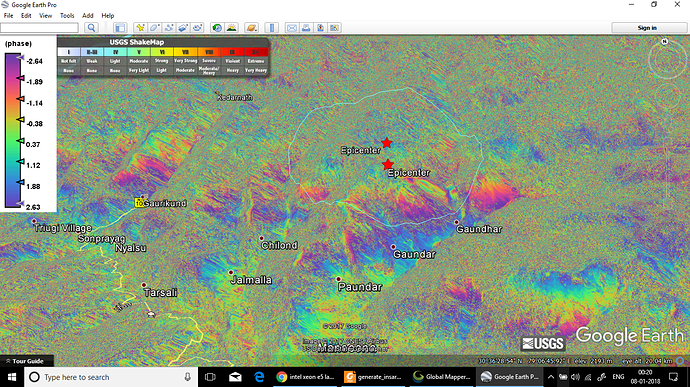
I try to obtain interferogram and displacement images of “Japan Earthquake April 2016 M7.3 Kumamoto” by processing Sentinel-1 images on SNAP. There was a similar work which processed the same sentinel-1 data but on another platfrom GEP (The Geohazard Exploitation Platform). They used DIAPASON processing chain which is available on the GEP. So that I can compare SNAP results and DIAPASON results. Although general interferograms look similar for ascending data, SNAP results look more noisy and DIAPASON results looks smoother and have nicer look. Well for descending data two results are quite different. And I really wanna learn the cause of that difference. DIAPASON results look nicer to me.
Note: After phase unwrapping two results look quite different for both asc and desc. But I will leave that part after we configure the reason for interferogram difference.
Data-Asc
- List item Pre (08/04/2016), S1A_IW_SLC__1SSV_20160408T091355_20160408T091430_010728_01001F_83EB
- List item Post( 20/04/2016), S1A_IW_SLC__1SSV_20160420T091355_20160420T091423_010903_010569_F9CE
Data-Desc
- List item Pre (03/03/2016), S1A_IW_SLC__1SSV_20160303T211629_20160303T211657_010210_00F131_E721
- List item Post (20/04/2016), S1A_IW_SLC__1SSV_20160420T211630_20160420T211658_010910_01059E_8779
The same data used. There was only VV polarization bands in the products.
I followed the same steps at “Sentinel-1 TOPS Interferometry Tutorial”. Basically the steps I followed are:
Step 1 ) S-1 Tops coregistration (I choose subswath and burst for the region)
Step 2 Interferogram formation
Step 3 ) S-1 Tops Deburst
Step 5) Topographic phase removal
Step 6) Goldstein phase filtering
Step 7) Terrain Correction
Step 8 …) I leave phase unwrapping part for now.
I used the default parameters for each operator.
Result are provided below. For details of DIAPASON results please look at the following presentation which I took the images. “GEP Diapason services for differential interferograms generation”
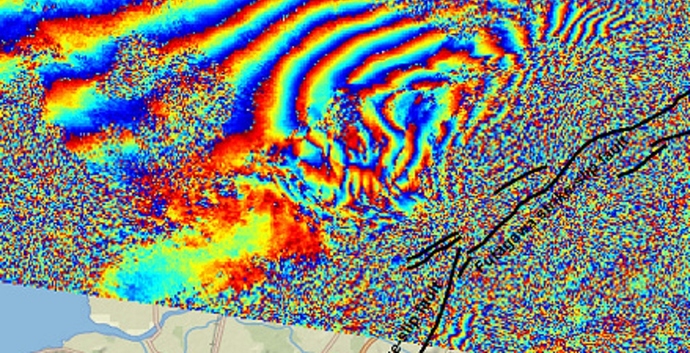
DIAPASON Asc
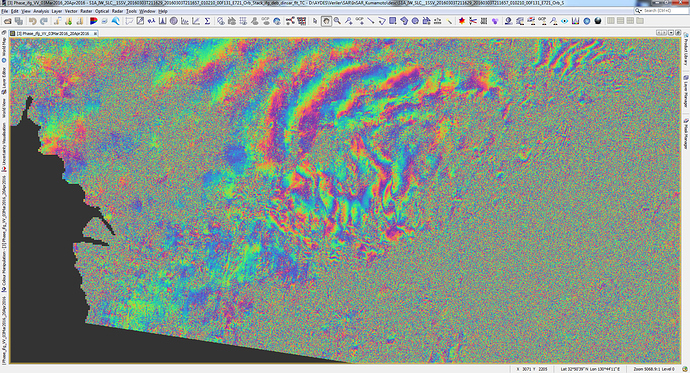
SNAP Asc
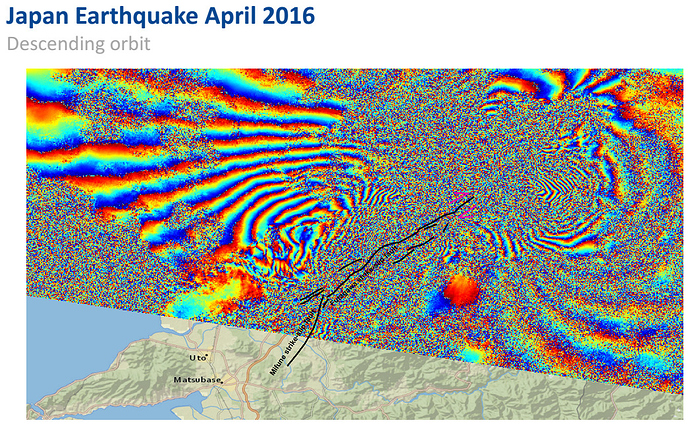
DIAPASON Desc
SNAP Desc
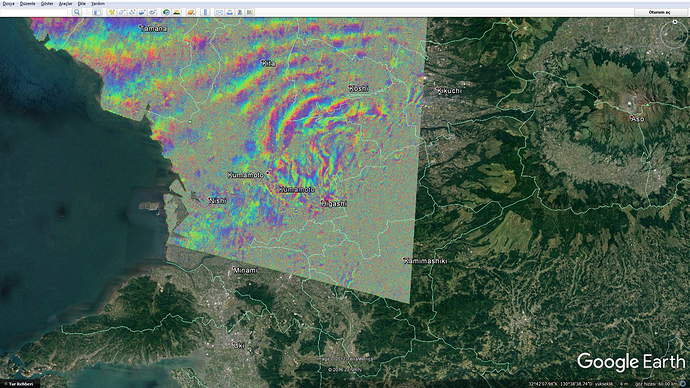
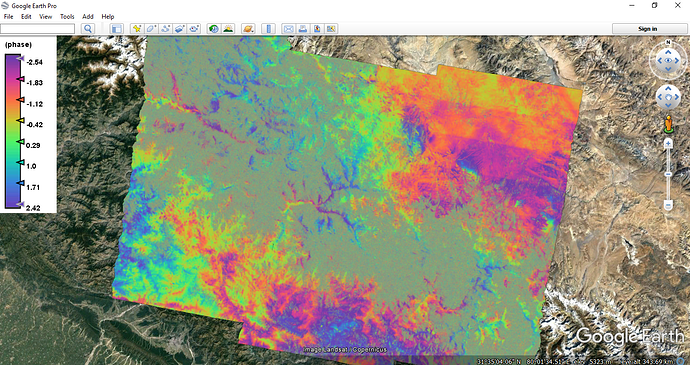
SNAP Desc On Google Earth
I guess I provided enough details.
Well for asc interferogram, patterns look similar however quality looks different. SNAP results seems more noisy. DIAPASON results look smoother. Is it just related with visualizing, or is there any intermediate step that I miss to apply? Well at Goldstein phase filtering step I increased window size and assumed to have less noisy result, but it didnt change anything.
For desc data, interferogram results are quite different. Maybe at coregistration step there could be algorithmic differences of two platform. Well I really have no comment here.
Your help will be appreciated.
Thanks.
