Thank you for your suggestions @ABraun. I tried them on a pair of imagery. This one is with coarse registration activated, 4000 GCPs.
Should I try the DEM based coregistration? This looks like a good improvement in comparison to the previous one.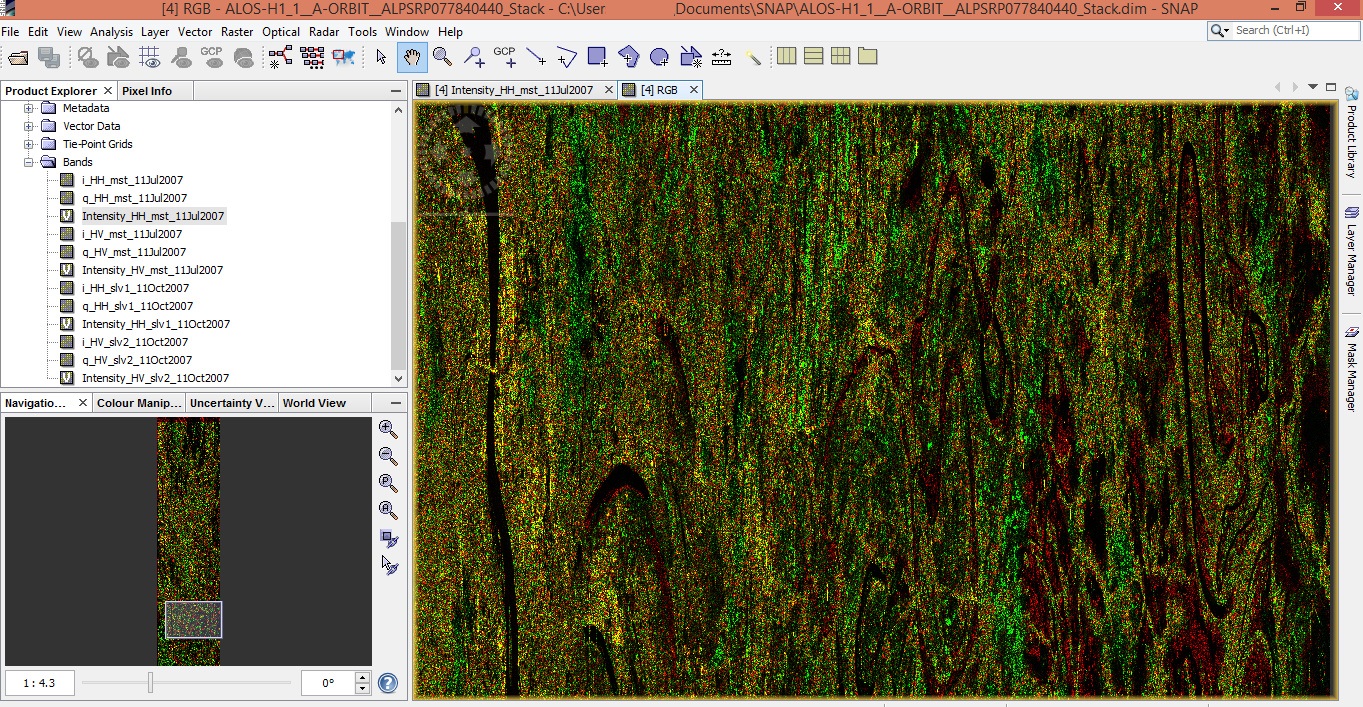
Depending on the area, you can get reasonable coherence with L-band data like ALOS with a two-year interval. The other big consideration is the baseline. They allowed the ALOS satellite to drift by more than 5 km over the first two years of operations, and then did a big orbital maneuver to move it back to the starting point in June-July 2008. This often means that two-year pairs from 2007 to 2009 have short baselines, while 1.5 year pairs from early 2007 to middle of 2008 have very long baselines.
I don’t know about SNAP, but other software packages can form interferograms between ALOS FBS and FBD scenes.
1 Like
your coregistration now looks better, even when there are still some strange patterns. But maybe the river is changing rapidly. I’d give the interferogram computation a try. You should see at least some patterns.
But if you are in a tropical area, there is little chance for successful interferometry due to decorrelation at the canopy.
Thank you for your advice @ABraun. I have been co-registering the rest of the pairs and I shall be trying the interferometric process now. Once a pair is complete I’ll send you a screenshot. 
Well, the place does have a few areas where scattered trees are available but will that affect the interferometry? There are also some urban patches here and there.
But no matter what happens I shall surely inform you once the job is done.
Thank you for your suggestion @EJFielding. I was a bit taken aback when I saw the irregularity in the image acquisitions. That is why I was unable to decide which images to choose for my job. But you see I have tried many softwares including ERDAS and SNAP for this end, but to no avail. Of course I’m a bit more comfortable with SNAP but I would like to try out an alternate software package as you mentioned, if FBS and FBD images can be combined. I would then compare the end products and ultimately choose the most suitable one.
It would be immensely helpful to me if you could kindly indicate which software package to use for my purpose.
Two InSAR packages that I know can handle ALOS FBS and FBD cross-interferograms are GMTSAR and the InSAR Scientific Computing Environment (ISCE). Both are pure command-line packages that only work on Linux or other Unix-type operating systems, including Mac OSX.
Thank you, for your response @EJFielding. I’ve tried to avail the first and second packages in the Virtual ware but both are pretty time consuming. Of course I would like to compare the end products of SNAP with ISCE too. Could you please direct me to the appropriate tutorials for my purpose?
UNAVCO has sponsored a number of short courses on using GMTSAR and on ISCE. They post the lecture notes on their website (http://www.unavco.org/education/professional-development/short-courses/2018/2018.html).
There is an online Forum for ISCE at: http://earthdef.caltech.edu/projects/isce_forum/boards
I am much more familiar with ISCE than with GMTSAR, but processing ALOS data requires a lot of RAM, so I can imagine that it would run slowly on a VMWARE virtual machine that does not have enough memory. I would give the virtual machine as much memory as possible.
1 Like
Thank you, @EJFielding for helping me out. I shall look into your links and try them out soon. The problem is that I have a machine which has a total of 8GB RAM and I normally work with that. So as you might have guessed it is a long process!
Well, if I need to get hold of a Linux OS based machine what should the RAM and internal memory configuration be for ALOS?
I would think that ISCE would run slowly unless you find a machine with at least 16 GB of RAM, and more is always better. The ISCE software also knows how to use multiple cores for many steps, so you can get faster processing by finding a machine with multiple cores.
I understand. Once I begin processing it in Linux I shall surely inform you. In the meanwhile, I thank you for your useful advice.
Hello @ABraun. I tried the interferometry. The patterns are better than before although dominant patterns cannot be depicted. But once I unwrap the image it turns out better.
But I guess this should do isn’t it?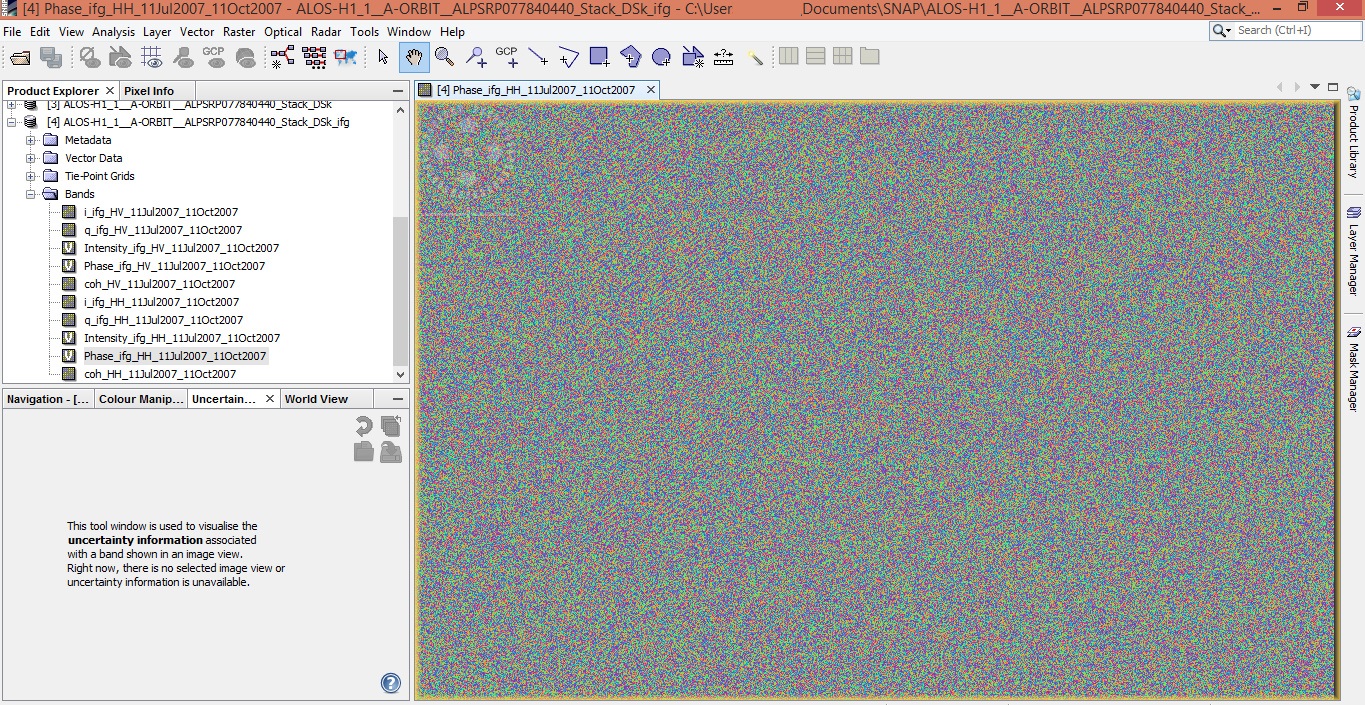
What is the main landcover type in your area?
Can you please show the unwrapped image?
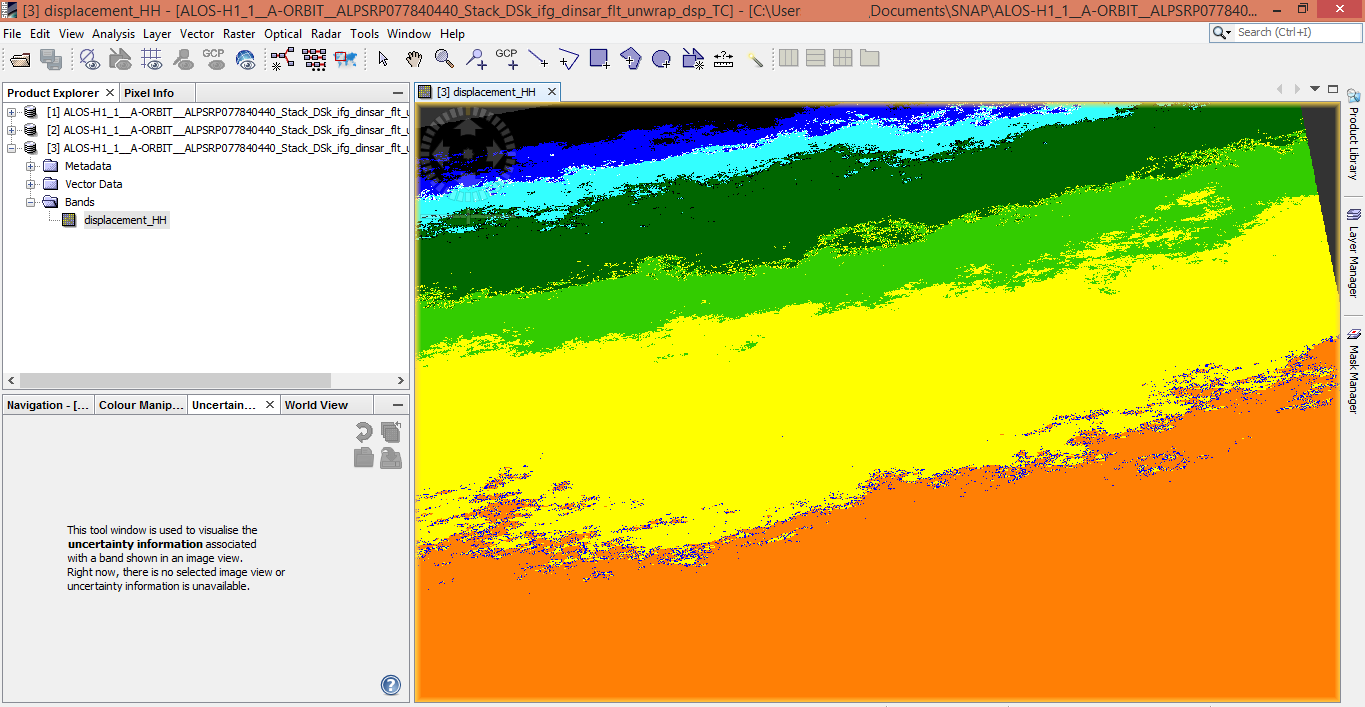
This is basically a deltaic plain @ABraun. There are no mountains or plateau zones either. There are scattered vegetation here and there and a dense outgrowth towards the bottom of the imagery, but I am not concerned with those zones. I believe this is much better than before, is it not so? If you look at the unwrapped version, you can actually find substantial patterns.
this looks better, yes. One problem I see in a delta is that no valid DEM exists. If no reliable information on topography is available, topographic phase removal can be inexact.
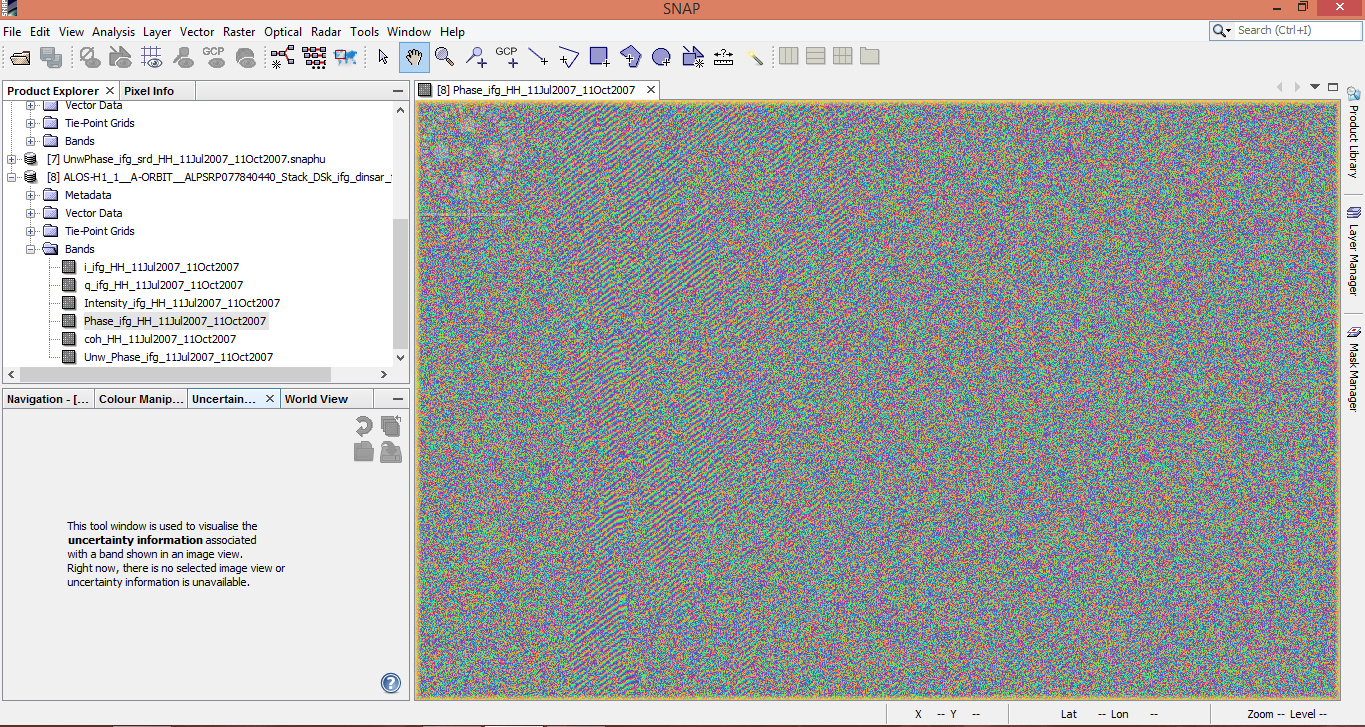
Out of interest, can you also show the unwrapped phase?
I understand. Therefore in this case, is there any option to be tried? I am sending you an image of the displacement.
The previous one is the unwrapped image.
I am sorry but this doesn’t seem right. The unwrapping is just adding up the phase values but without any usable information.
Did you have a look at the coherence layer? It tells you where the interferometric information is reliable. As long as you don’t have some larger connected areas of good coherence, unwrapping will just produce a random pattern.
InSAR in deltas is probably very challenging because the surfaces are no good radar targets. Please someone correct me if I am wrong but I doubt that any image pair will give you petter fringes.
How long is the time between these images?
The interferogram looks like it’s almost only noise. Unwrapping noise can produce a “result” but it will not be useful for anything…
Hi @draco
I am not sure but the wrapped interferogram you showed seems to have still the reference phase of the ellipsoid to be removed.
Had you remove it? Or is it pure interferogram (phase difference between master and slave)?
Could you also show the coherence you got?
@ABraun I again forgot about the coherence. Well, I am trying it out. But here I have a question, there might be very minimum subsidence in this zone. Even then if it is possible to retrieve subsidence rates I have to generate it.  So how much should be the threshold?