Some examples. Left: DEM assisted corregistration. Right: Corregistration
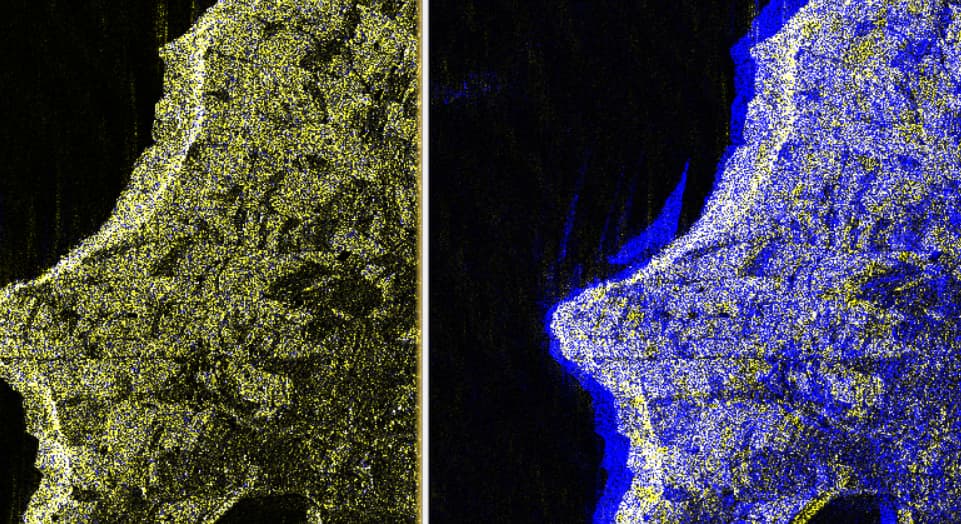
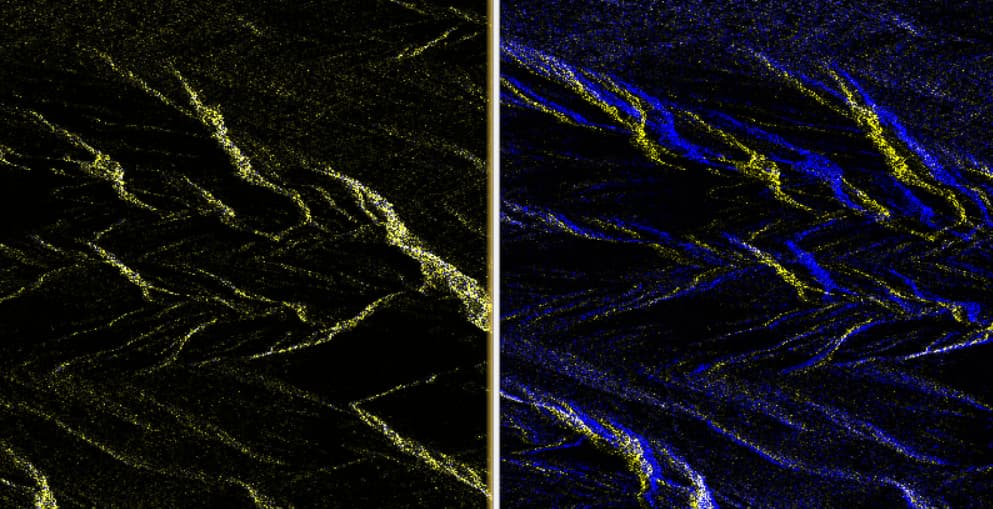
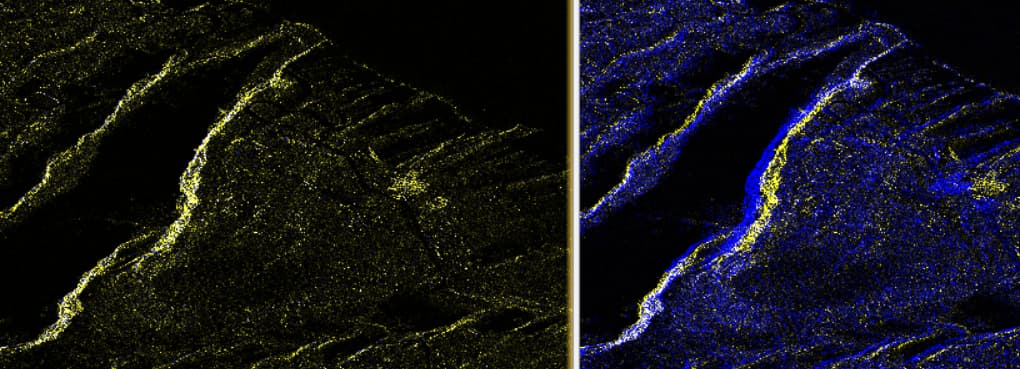
Clearly the Corregistration did not work as there is an obvious shift.
Some examples. Left: DEM assisted corregistration. Right: Corregistration
Clearly the Corregistration did not work as there is an obvious shift.
Thank you. Yes, the coregistration on the right will understandably not give you the correct interferogram.
What is the perpendicular baseline between the sensors?
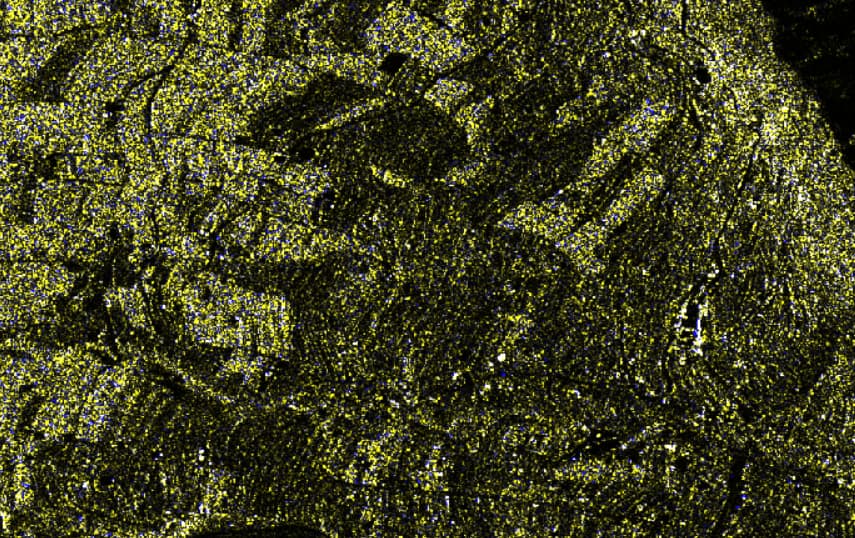
In the left images, why dont we see blue? In that channel I have put the intensity of the slave but it does not show up as in the example you mentioned. The perp baseline is 112 m
if red and green are image and blue is image 2, the DEM-based coregistration failed (empty second product) and the GCP-based coregistration simply was inaccurate.
Checking the individual intensity bands on the DEM-Corregistered output, I can see the blue color but not very present. I guess a good sign of corregistration?
yes, but especially cities and permanent structures should be white and not yellow.
Yes indeed, I dont have large urban areas. The image is mainly dominted by vegetation but the few urban areas look white.
So, in conclusion for the corregistration, it turnes out that the DEM-corregistration worked fine vs the corregistration withouth it.
I get the theoretical difference between a DEM-assisted vs. non-assisted corregistration. But why am I not managing to create a proper output without the help of a DEM?
It is impossible to say where the process goes wrong, unless you run the steps in the graph one by one and scrutinise the output products and log contents at each step.